Question: Can you provide an update on how the condo market is doing?
Answer: Arlington’s condo market began shifting in favor of buyers this summer, after two years of a very strong seller’s market, when historical numbers of condos began hitting the market at the same time demand subsided. I’ve written about these changes four times since (falling values, visualizing high inventory, first signs of a trend, and first signs of a shift).
November Might be a Turning Point
For the first time since June, we’ve seen a reduction in the Months of Supply (MoS) of Arlington condos. Months of Supply is a great measure of supply and demand (lower MoS = stronger market with higher demand and less inventory).While the reduction in MoS is slight, it’s a positive sign nonetheless that the market is either closer to finding its level again or may soon show signs of strengthening. However, one month, particularly a winter month, is not enough to establish any real change, we will need to see what the next 3-6 months bear.
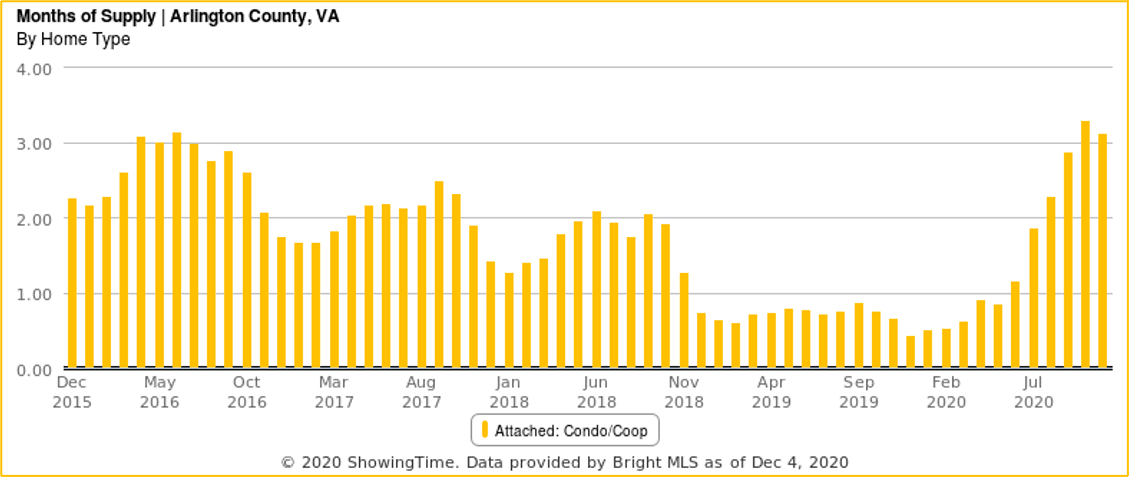
Figure 1
Multiple Key Indicators Show Positive Signs
My hope for a settling or strengthening of the condo market is not solely based on one metric, there are other key metrics that suggest November may be the first month of a settling or strengthening condo market.Absorption Rate (Figure 2), a measure of demand, increased ever-so-slightly in November, the first increase since May, albeit still down nearly 68% from the December 2019 Absorption Rate.
The number of condos for sale during November decreased for the first time since May (Figure 3), albeit slightly. The better news, however, is that the decrease in total condo inventory doesn’t seem to be caused by frustrated sellers pulling their condos off the market, rather due to promising contract activity (Figure 4), which was up 41% year-over-year in November.
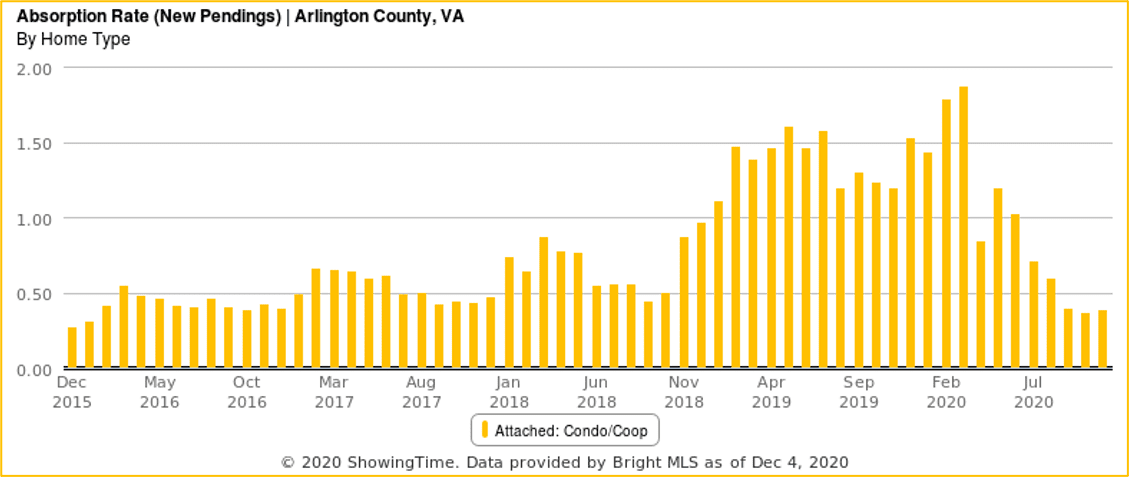
Figure 2
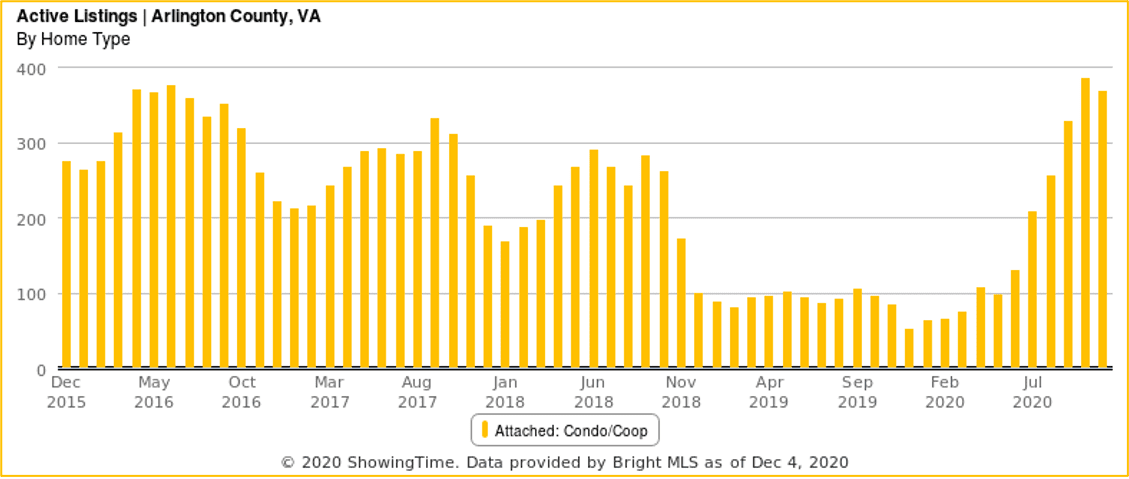
Figure 3
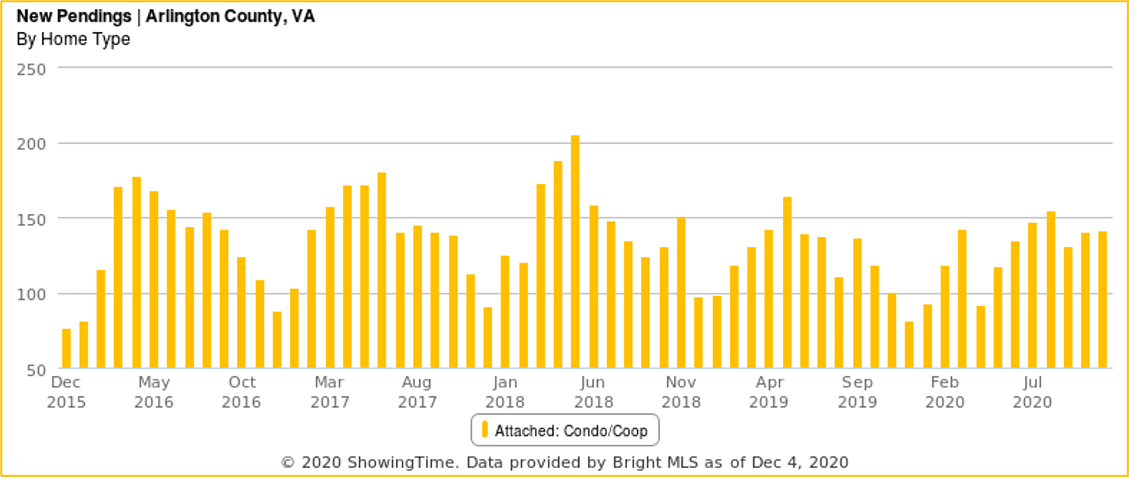
Figure 4
Looking Ahead, Eyes on March to May
Over the next few months, I’ll be looking closely at whether these trends (stronger demand, falling inventory) continue, find a level, or revert back to what we’ve seen since this summer. I’ll be particularly interested in what year-over-non-COVID-year numbers looks like and if we settle into normal spring activity for inventory and demand.For example, while the charts above are positive indicators for the condo market, Figure 5 shows just how much inventory (new listings) is still coming onto the market, with November generating nearly 79% more condo listings in 2020 than in 2019, but only a 41% increase in contract activity.
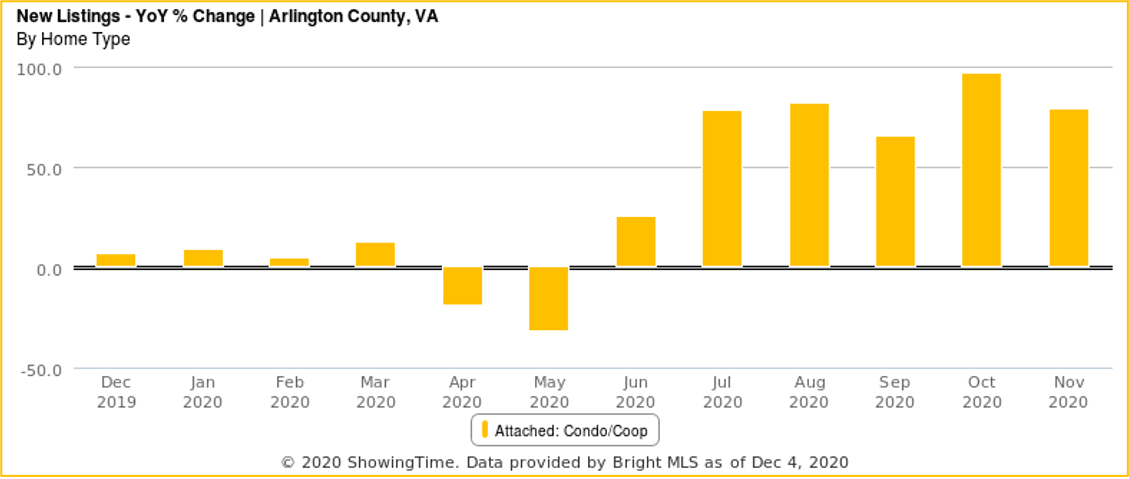
Figure 5
I think that March to May 2021 are going to be very interesting months, statistically speaking, and will be excellent indicators of what the market might look like for the next few years, until the next major market event (e.g. Great Recession, Amazon HQ2, COVID). I think/hope that by then, we will also have a better understanding of how the Federal Government and private companies will address teleworking beyond COVID and thus whether commute time will be prioritized differently by buyers.
If you’d like to discuss buying or selling strategies, don’t hesitate to reach out to me at [email protected].