Question: Have you seen the effects of the DOGE workforce and spending cuts showing up in the housing market data?
Answer: I’ll be answering “how’s the market” for you throughout the year while we absorb the effects of DOGE and the seesaw of critical decisions being made about Federal jobs and spending.
Headline Summary: Demand is down, inventory is up (clearly DOGE-related), but most of the DC area housing market is performing well for sellers because inventory levels are still well below current demand (in most sub-markets).
Now for those of you who want more than a one-sentence summary, let’s look at some of the underlying data that I’m watching and what it means for forecasting…
Demand is Down, Modestly
There is no doubt that demand is down, you can feel it in the market and see it in the data, but it’s a modest decrease and there are still plenty of motivated buyers across price-points and property types in the market.
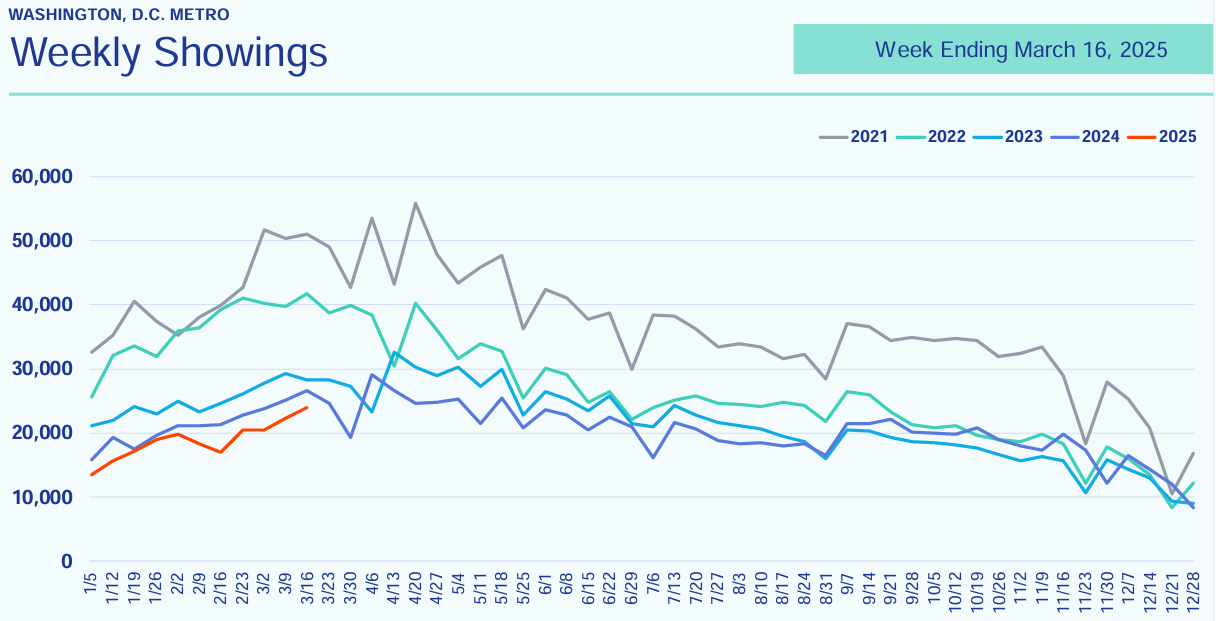
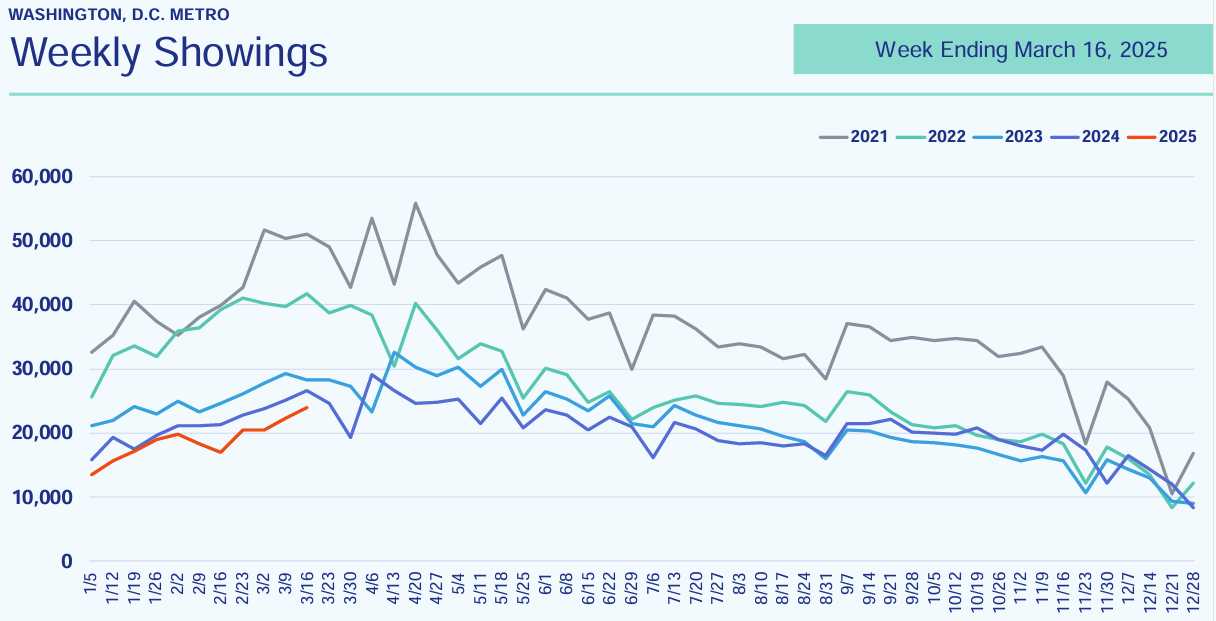
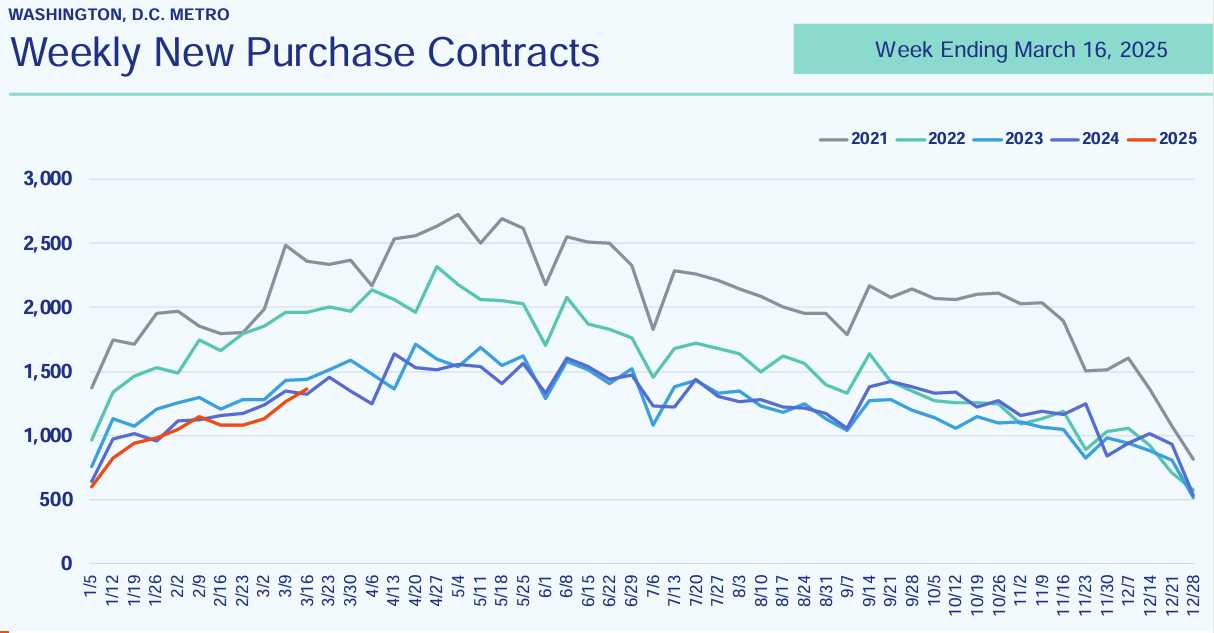
You can see the drop in demand in the two charts below. Showings are trending lower year-over-year by about 10% (and last year was already well below average) and pending contracts have trended below last year’s numbers most weeks, despite this past week jumping to +1.5% year-over-year. While pending contracts are only marginally lower on the year, there are currently more homes for buyers to choose from (detailed in the next section) so contract activity to available supply (absorption) is much lower than last year, indicating lower demand than what we see in pending contracts data.
Supply is Up…and Data Points to DOGE
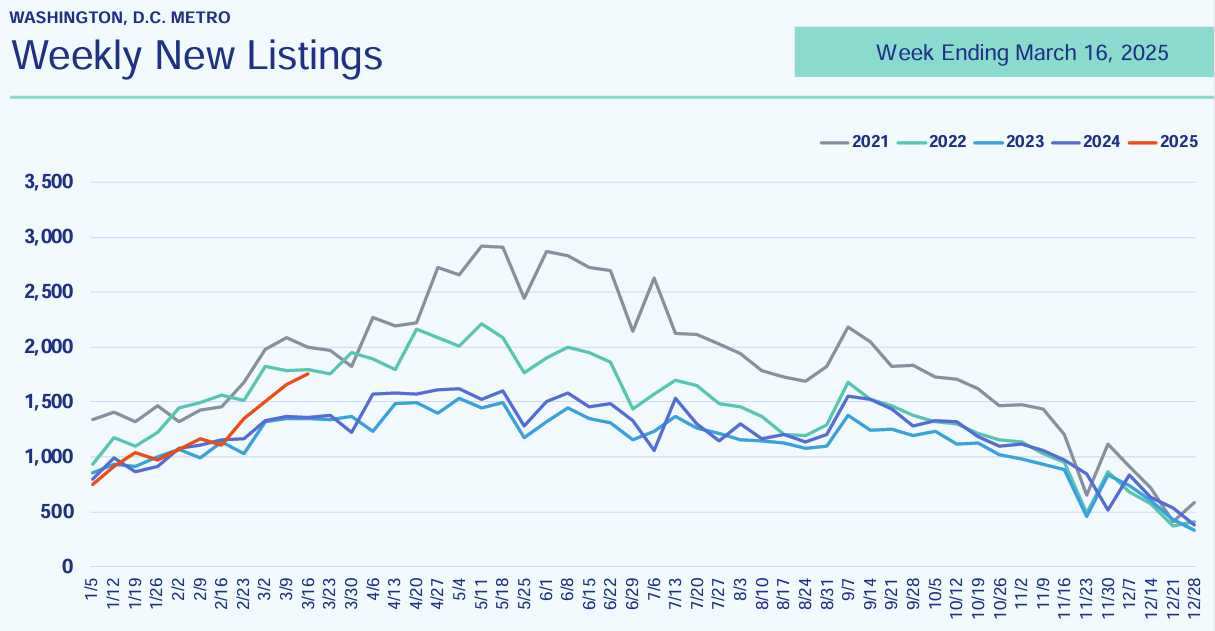
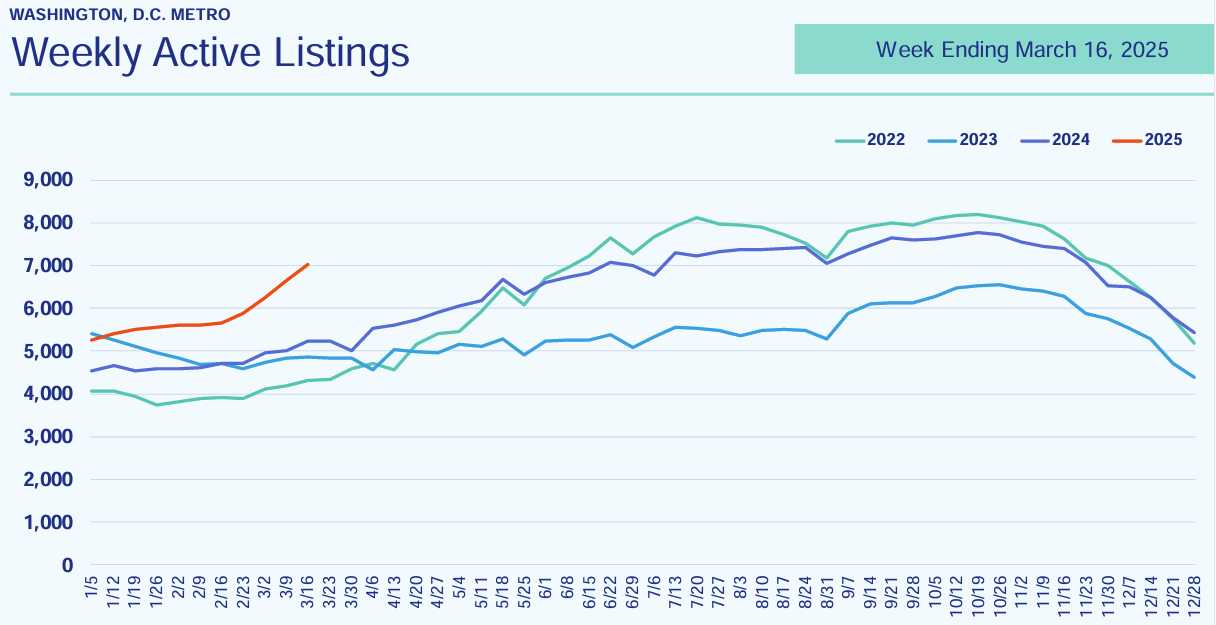
We have enough weekly data to start establishing trends and it seems quite clear that the effects of Federal workforce and spending cuts by DOGE can be directly correlated to a sharp increase in weekly new listing activity and total active inventory.
Check out the orange line in each of the two charts below, that sharp turn upwards is four weeks ago, when things really ramped up with DOGE’s cuts to the Federal workforce and spending.
New listing activity in Loudoun County has been about 65% higher year-over-year each of the last two weeks, while Fairfax County has hovered around 20% higher year-over-year for the past four weeks. I’ll need to see the data continue in Loudoun for another two weeks before I’ll consider it a legitimate data trend.
Arlington County new listing activity is too low (well below 100 listings per week) to rely on weekly data to extract trends, but on a monthly basis, new listing activity in Arlington was down 12.6% year-over-year in February so currently limited signs of DOGE-related supply shifts in Arlington.
Context Matters
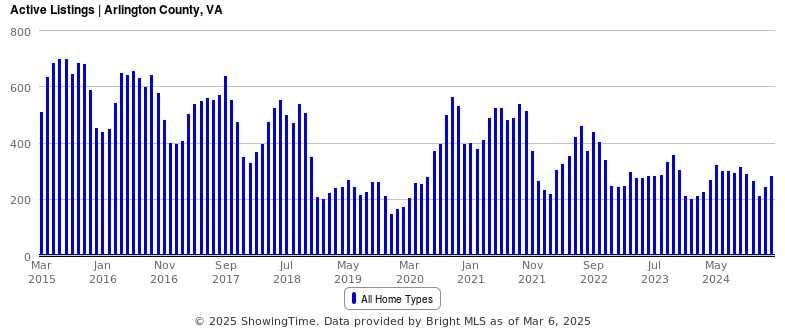
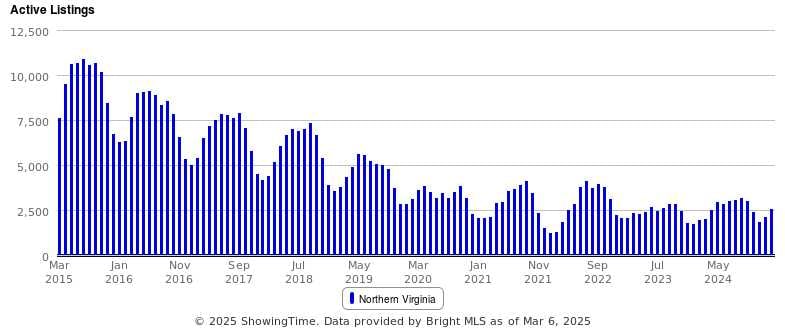
Context matters when studying how underlying data will show up in actual market performance and property values. Yes, new listing activity and total unsold inventory are on the rise, but the truth is, the Northern VA market could really use it. Zoom out from what is happening week-to-week and year-over-year and you’ll see in the charts below that inventory in Arlington (first chart) and Northern VA (second chart) is still well below the ten-year average.
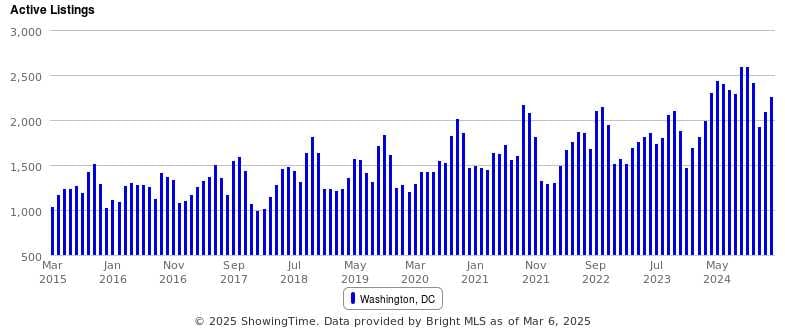
On the other hand, look at Washington DC (third chart) and you’ll see a different story – a market that is already trending well above its ten-year average and can ill afford a further increase in inventory levels (note: the DC condo market is responsible for most of this supply).
Sellers Optimistic and Worried All at Once
People respond to uncertainty and risk in different ways, and you can see that showing up in seller behavior. Over the past month, the median asking price has increased sharply across the DC area (up 2.2% to 7.5% each of the last four weeks), while the percentage of homes for sale with a price cut is up to 8.4% compared to 6.2% last year. So, on one hand, sellers have launched their sales with record high asking price and on the other hand, more sellers are taking their medicine and cutting their price.
The Market Forecast is…
The ultimate question for buyers and sellers is what this means for future home values and days on market.
The underlying data (lower demand and higher supply) indicates downward pressure on prices, but for now that likely means downward pressure on price appreciation, not downward pressure on current home values.
That’s a big difference that needs to be understood; the current data suggests that we will see limited or no appreciation in 2025, not homes losing value. It’s important to remember that this is a broad statement on the overall market and different sub-markets (geographic, property type, price point) will experience the 2025 market in uniquely different ways. Just because you see one or two homes in your neighborhood/building perform one way, doesn’t mean that’s the story for the entire market.
Right now, I’m tracking most of the underlying data weekly, which is less reliable than larger monthly or quarterly data sets. March data is going to be a strong indicator of the DOGE-effect because it will be the first full month of housing data where DOGE-related consumer behavior will be present for the entire month. Of note, this data will be leading indicator data like listing activity and contract activity; we won’t start seeing sale price activity in the DOGE housing market until late April/May and it’ll really take full Q2 price data to start gathering accurate measurements of the real price effects.
And if you want one more twist to the forecasting formula that highlights all the opposing forces in play, heading into 2025, the NerdWallet Home Buyer Report found that 15% of Americans plan to purchase a home within the next 12 months, the highest percentage since 2019. There is a lot of pent-up demand pushing back.
If you’d like to discuss buying, selling, investing, or renting, don’t hesitate to reach out to me at [email protected].
Upcoming (pre-market) ERG Listings, Details and Additional Listings Available by Request
-
Rosslyn – 1BR+den/1BA/900sqft – Condo (2007) – 1800 Wilson Blvd Arlington VA 22201
-
Courthouse – 2BR/2BA/1,100sqft – Condo (1992) – 1276 N Wayne St Arlington VA 22201
-
Courthouse – 3BR/2BA/1,400sqft – Condo (1992) – 1276 N Wayne St Arlington VA 22201
-
Arlington Ridge/Aurora Hills – 3BR/2.5BA/2,450sqft – Detached Single Family (1961) – S Grove St Arlington VA 22202
-
Yorktown – 6BR/6.5BA/6,000+ sqft – Detached Single Family (2026) – N Greencastle St Arlington VA 22207
-
Highland Park/Overlee Knolls – 6BR/5.5BA/5,000+ sqft – Detached Single Family (2025) – 22nd Rd N Arlington VA 22205