Question: How has the Arlington condo market performed in the first half of 2025?
Answer: The condo market is more susceptible to downturns in the housing market because condo buyers can almost always find a suitable alternative by renting an apartment, if buying loses its appeal. With high interest rates and uncertain local economic conditions in the first half of 2025, the Arlington condo market suffered a loss in value, unlike the detached single-family market, and is having one of its worse years in the past two decades.
Prices and Competition Down in the First Half
Let’s look at the performance of Arlington’s condo market in the first half of 2025 compared to the first half of the previous four years:
-
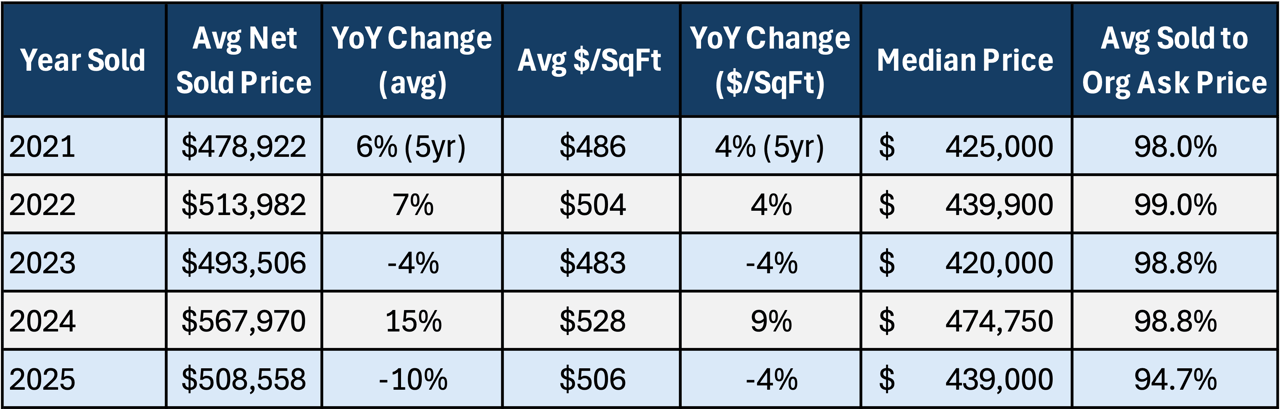
The average price of a condo fell by 10%, to just over $508,500, and the average $/SqFt fell by 4%
-
The median price of a condo fell by 7.5%, to $439,000
-
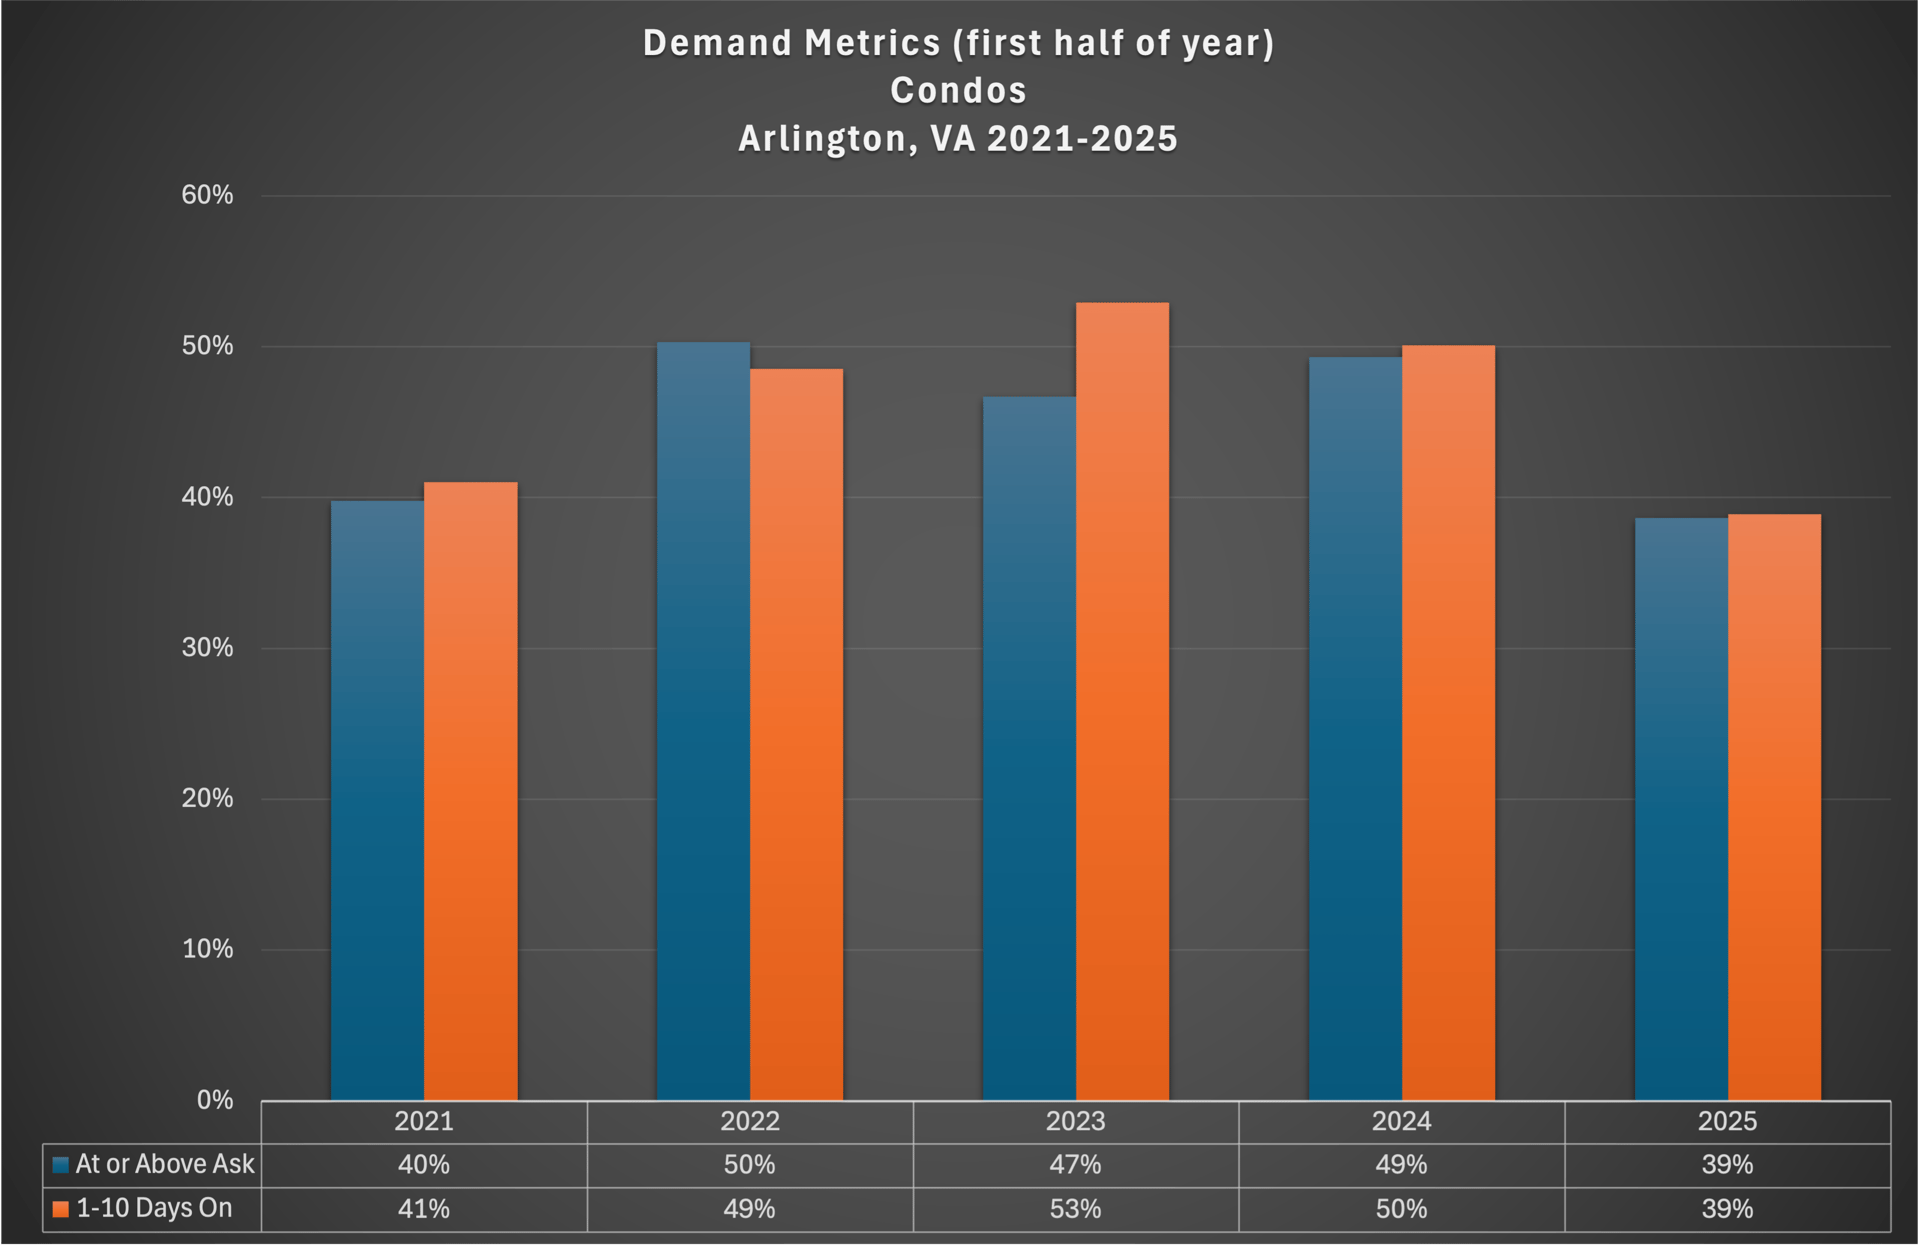
Demand fell sharply with just 39% of condos selling within the first ten days on market and just 39% selling for at or above the asking price
-
After significant price gains in 2024, seller optimism was high heading into 2025 and the initial asking prices reflected that. Low demand led to substantial discounts off the initial asking price, with condos selling for an average of 5.3% below the original ask, compared to about 1% each if the past four years.
-
Most of the losses seem to come from the two-bedroom condo market, where the average price dropped by 7%, compared to a 1% drop in the one-bedroom market
Looking Forward
After last year’s abnormally high condo price increases, the first half of 2025 seems like a combination of normal market correction, amplified by downward pressure from local economic uncertainty (DOGE effect). I don’t get the sense that we are seeing runaway price declines because demand is responsive to condos priced at “corrected” levels, as opposed to demand being completely washed out.
I think we will see prices maintain their current levels through 2025 and into 2026, unless there’s a material drop in interest rates (prices will jump) or local economic confidence significantly worsens (prices will drop further).
How the Data is Organized
For my mid-year reviews, I like to compare the first half of the year to the first half of prior years, rather than comparing the first half of the current year to the full year in prior years. We tend to see a stronger market (higher demand, more competition) in the first half of the year than the second half, so this approach gives us a better apples-to-apples comparison.
The data is organized by homes that went under contract in the first half of the year because it’s more reflective of actual buying activity during that period; as opposed to looking at homes that closed in the first half of the year, but may have gone under contract many months prior during different market conditions. I also use “net sold” price, which factors in any seller credits to a buyer, instead of just the standard sold price.
If you’d like to discuss buying, selling, investing, or renting, don’t hesitate to reach out to me at [email protected].
Upcoming (pre-market) ERG Listings, Details and Additional Listings Available by Request
-
Falls Church – 5BR/3BA/2,170 sqft – Detached Single Family (1950) – Bolling Rd Falls Church VA 22042
-
Falls Church City – 4BR/4.5BA/3,000+ sqft – End-unit townhouse (1995) – Rees Pl Falls Church VA 22046
-
Arlington Ridge/Aurora Hills – 3BR/2.5BA/2,450sqft – Detached Single Family (1961) – S Grove St Arlington VA 22202
-
Yorktown – 6BR/6.5BA/6,000+ sqft – Detached Single Family (2026) – N Greencastle St Arlington VA 22207