Question: How did the Arlington and Northern VA housing market perform in the first quarter?
Answer: Remember two months ago when social media and various media outlets announced the DC area housing market was collapsing? I wrote at length why they were wrong then (link) and through the first quarter of 2025, they’re still wrong. There’s no doubt that the market is fragile and more favorable for buyers than it’s been in a while, but there is nothing in the data or my experience in the market to indicate anything extreme is happening.
The Q1 Market Shift is Significant
There is no doubt that we are seeing significant market shifts across the region – we can feel it within the industry and we can see it in the data (illustrated below). Within our team, we see the fragility of the market in real-time with some homes getting multiple offers and six figure escalations and others cutting prices after unexpected days on market, offering buyer incentives to put a deal together.
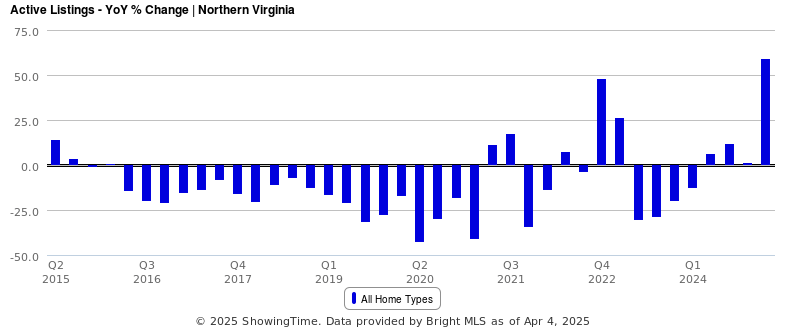
The two charts below show the year-over-year (YoY) quarterly change in the number of homes for sale in Northern VA and Arlington, over the last ten years. Q1 2025 was the largest YoY quarterly increase in the past decade and 5th largest for Arlington. The four quarters with a higher YoY quarterly increase in Arlington were driven purely by the historical surge of condos for sale in 2020 and 2021 in Arlington.


This is NOT a Fire Sale
One of the more ridiculous storylines floating around when DOGE started cutting federal jobs and spending was that everybody was putting their home up for sale and fleeing the area. That was objectively false then and it remains false as we collect more data.
According to Redfin’s Data Center for all US Metro areas, new listing volume in Q1 2025 was up 5.2% nationwide. Arlington County is up 5.5%, Fairfax County is up 8.3%, and Loudoun County is up 21.4%. I suspect that the higher increase in Loudoun is correlated to new Return-to-Office mandates, causing more homeowners to sell to shorten their commute.
Keep in mind that these YoY increases are coming from years if massive drops in new listing activity, so we are still seeing a small number of homes coming to market relative to the ten-year average. New listing activity in Loudoun County needed to increase by 76.1% YoY in Q1 2025 to match the listing activity from Q1 2018.

Still a Seller’s Market, Just Less So
The market became so favorable for sellers over the past five years that despite the significant YoY changes, we have not moved out of a seller’s market.
The first chart highlights just how little effect the YoY increase in homes for sale has on the total number of homes for sale in Northern VA relative to the past ten years. There were 58% fewer homes for sale in Northern VA in Q1 2025 compared to Q1 2016.
The second chart shows the Contract Ratio (ratio of homes under contract to homes for sale, higher numbers equal higher absorption and a stronger seller market) in Arlington. While Q1 2025 is a shocking 47.9% lower YoY, it is similar to the absorption rate before the Nov 2018 Amazon HQ2 announcement led to a demand surge.


Prices Are Higher, But That’s Misleading
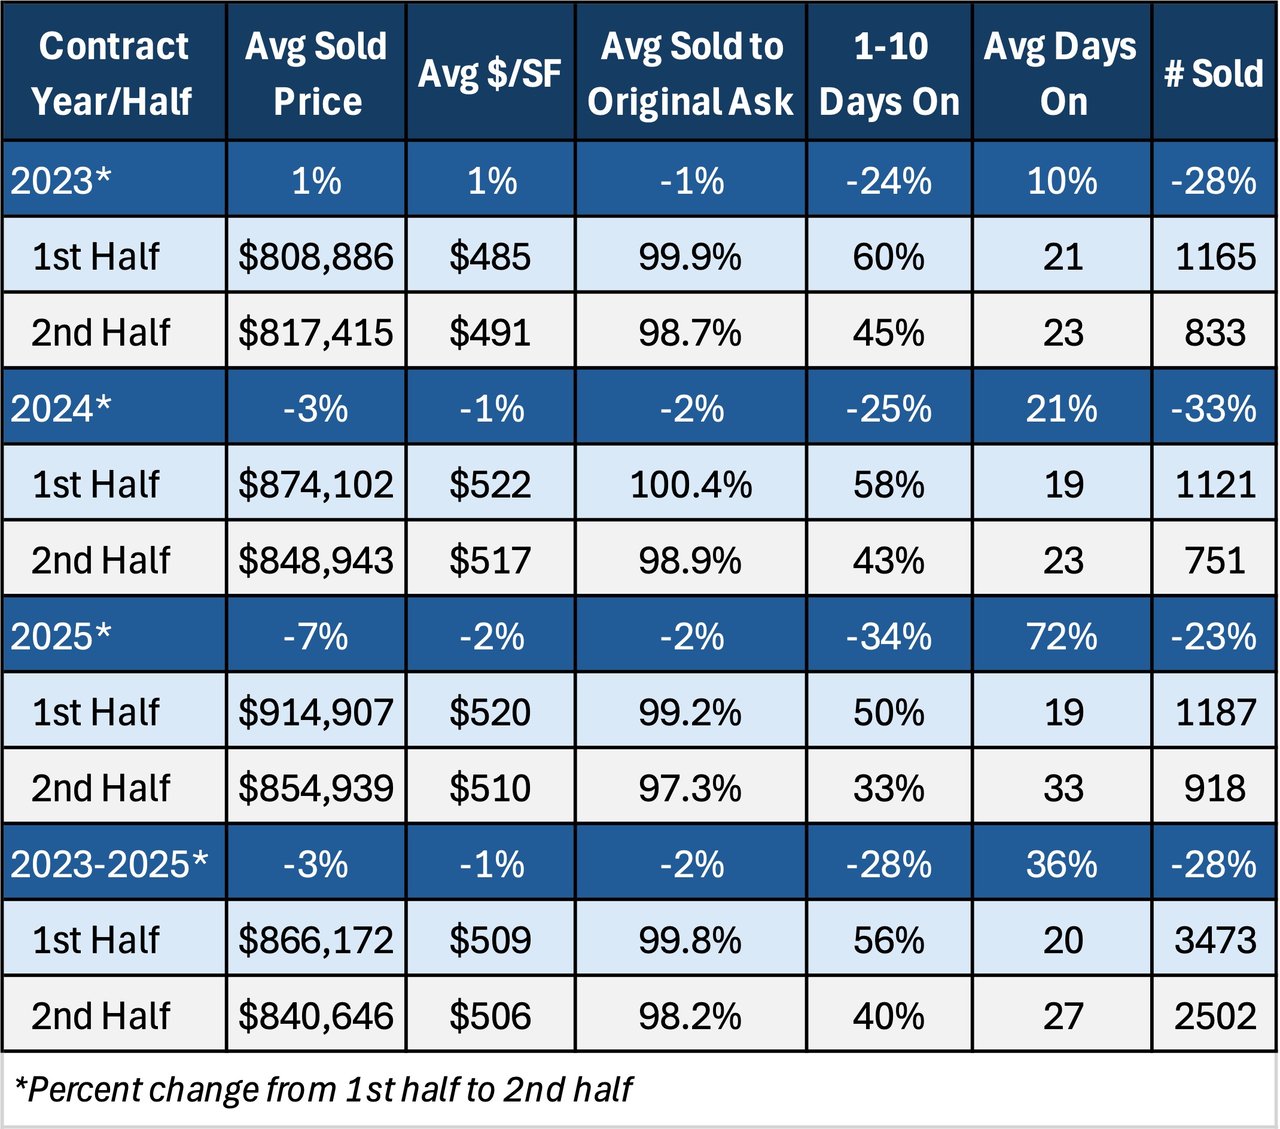
All leading indicators suggest that there is downward pressure on prices, but the average closing price of a home in Q1 2025 was up 7.4% YoY, but that is a bit misleading if you want to measure the DOGE-effect on the local housing market. The 7.4% increase is more reflective of late 2024, early 2025 market conditions (pre-DOGE). Closing prices are a lagging data point because it takes 30-60 days for most homes to close after going under contract and the homes that will take the biggest hit on price generally take longer to sell, so their data will be even further delayed.
My advice to those of you tracking housing data closely is to focus on the leading indicators now and wait until this summer to start assessing how prices are responding to the post-DOGE market conditions. Personally, I am most interested in what we find in the Q2 data once it’s published in early July.

For those of you relying on market data for a home purchase or sale, remember that different sub-markets (geography, price point, property type) are experiencing different (better or worse) market conditions than the broader market so it’s critical to understand the data trends for the sub-market you’re buying or selling into.
If you’d like to discuss buying, selling, investing, or renting, don’t hesitate to reach out to me at [email protected].
Upcoming (pre-market) ERG Listings, Details and Additional Listings Available by Request
-
Courthouse – 2BR/2BA/1,100sqft – Condo (1992) – 1276 N Wayne St Arlington VA 22201
-
Yorktown – 6BR/6.5BA/6,000+ sqft – Detached Single Family (2026) – N Greencastle St Arlington VA 22207
-
Arlington Ridge/Aurora Hills – 3BR/2.5BA/2,450sqft – Detached Single Family (1961) – S Grove St Arlington VA 22202
-
Ballston – 2BR/1BA/919sqft – Condo (2005) – 1001 N Randolph St Arlington VA 22201
-
Tara Leeway Heights – 7BR/7.2BA/7,500sqft/half acre/pool – Detached Single Family (2026) - 1500 N Harrison St Arlington VA 22205
-
Highland Park/Overlee Knolls – 6BR/5.5BA/5,000+ sqft – Detached Single Family (2025) – 22nd Rd N Arlington VA 22205