Question: What trends are you seeing across the DC Metro real estate market?
Answer: The DC suburbs are holding strong despite sticky interest rates, but DC is showing some weakness. Let’s jump into the charts and data that I think best highlight what we’re seeing so far this year:
Low Listing Supply Is the Main Story
Chart #1: One of the most interesting charts I’ve seen below compares this spring (Mar-May) to the previous Oct-Dec new listing volume. Historically, we see the least number of homes listed for sale during the 4th quarter of each year and the most homes listed for sale Mar-May each year. New listing volume has been so low in 2023 that Mar-May 2023 has a similar listing volume to what we usually see from Oct-Dec.
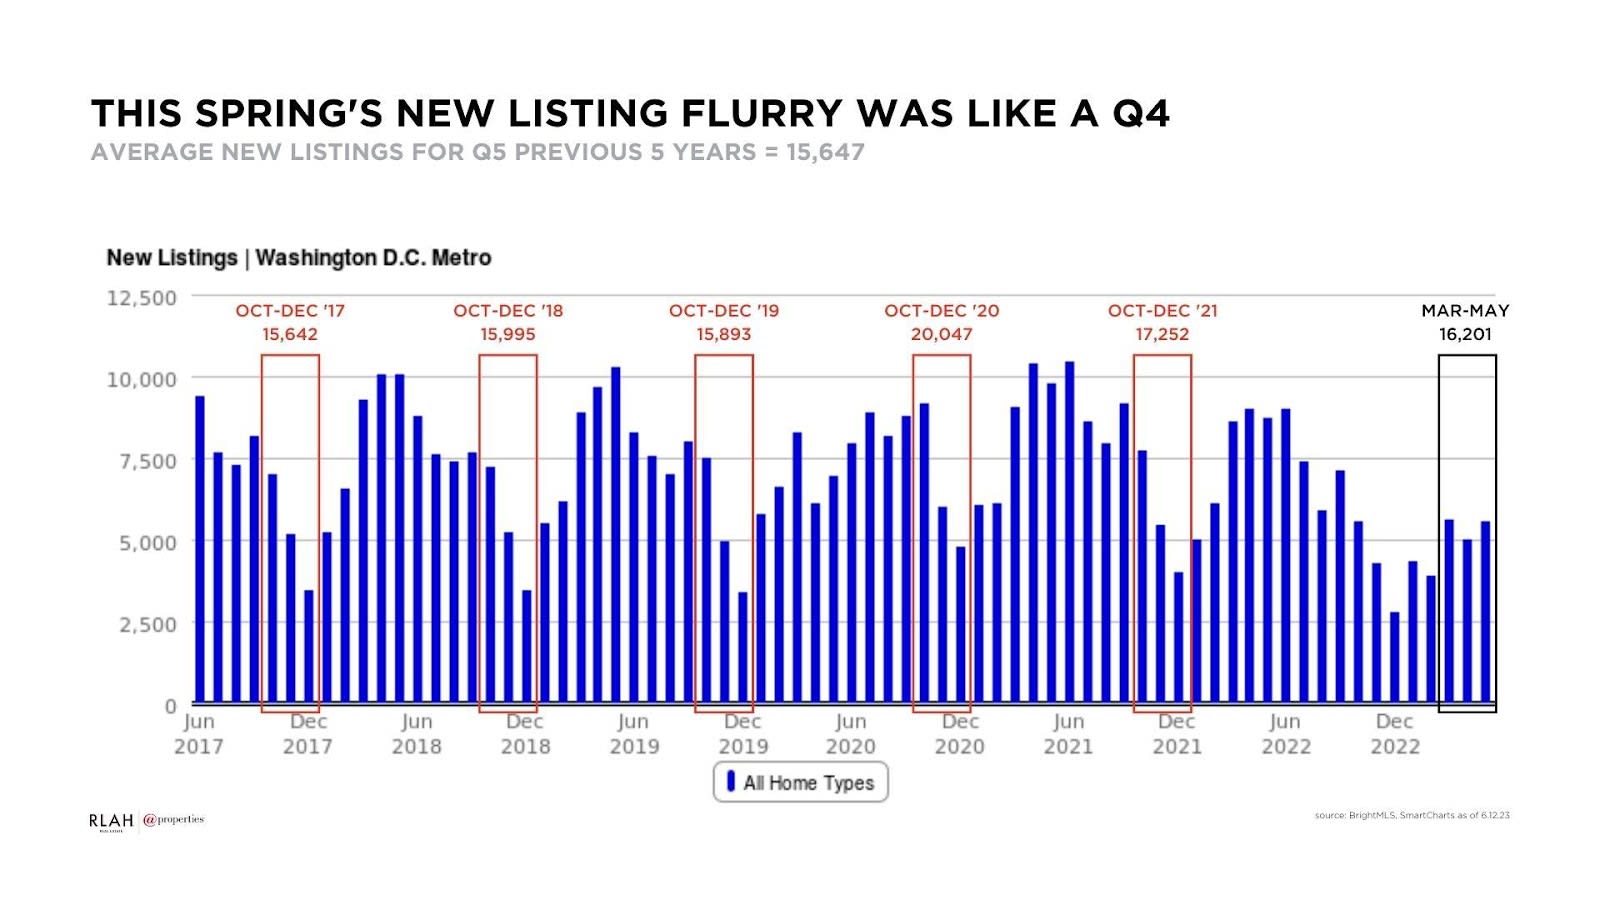
Chart #2: We’re currently in our 15th straight month of negative year-over-year new listing activity and the last positive month was up only .5% year-over-year
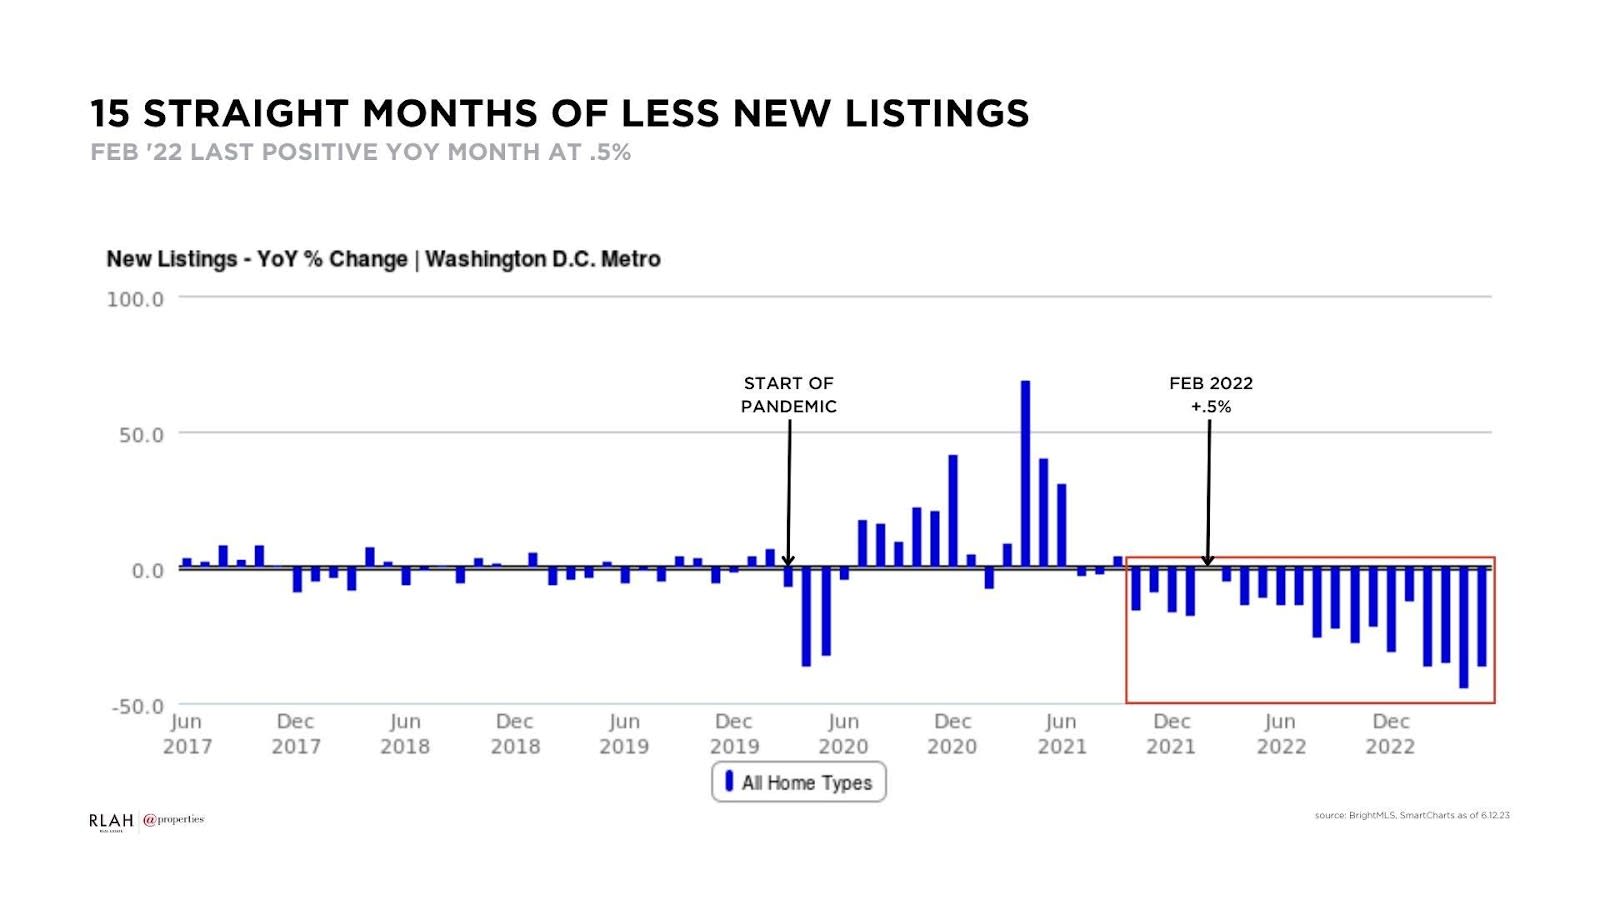
Chart #3: All DC area submarkets are desperate for new listings, but Fairfax Co. has it the worst with a drop in new listings volume by more than 40% year-over-year. DC has had the lowest drop but it’s still down by nearly 30%.
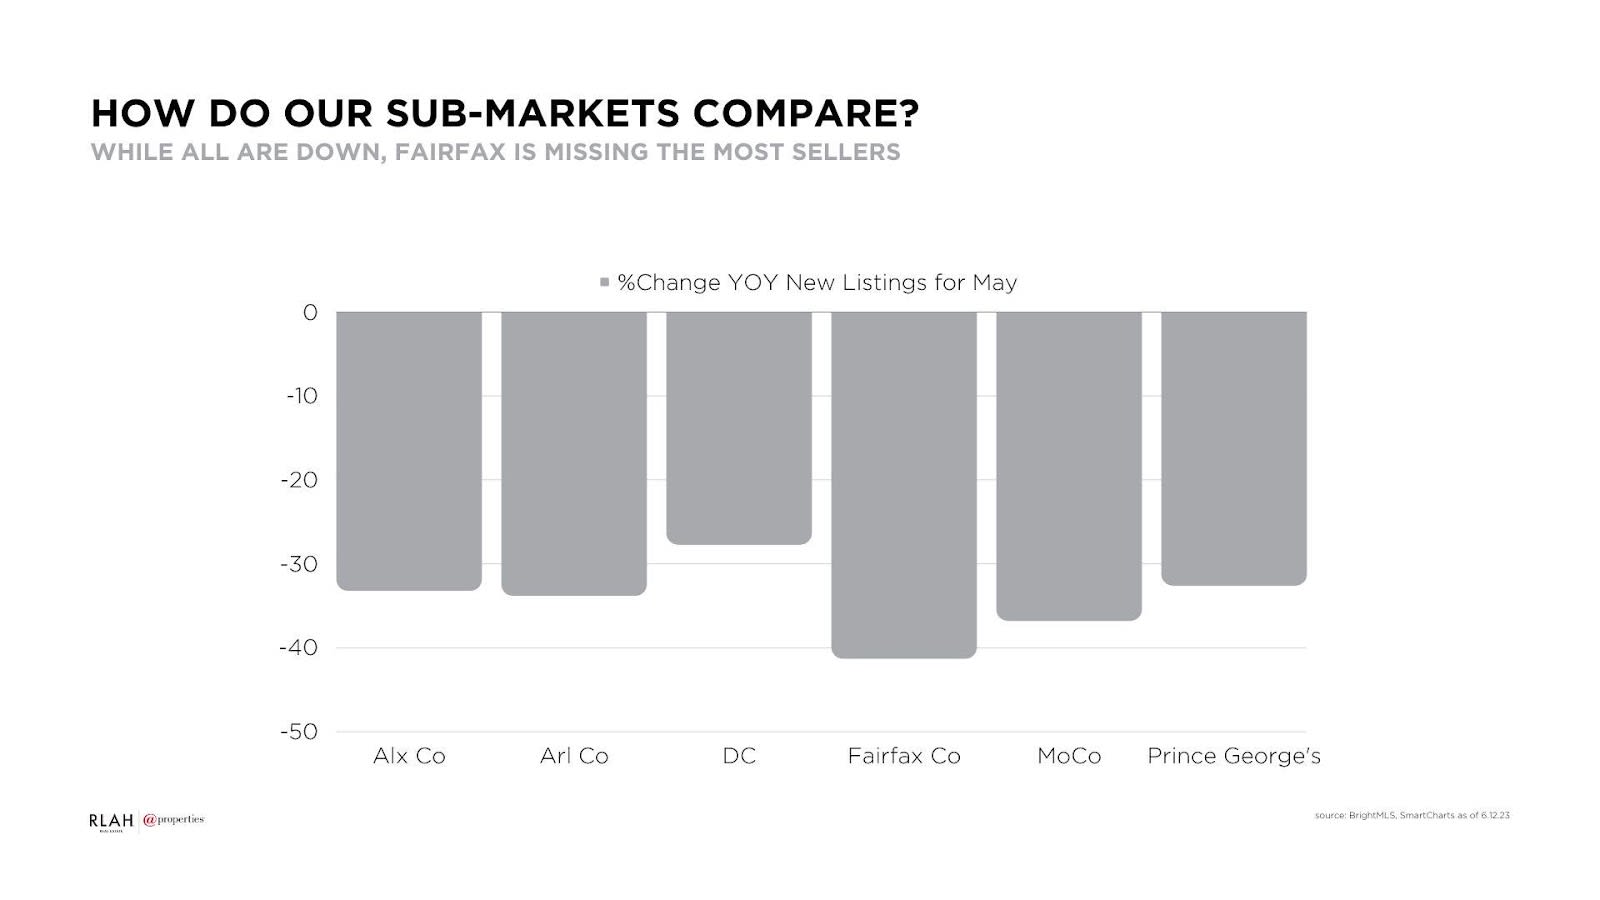
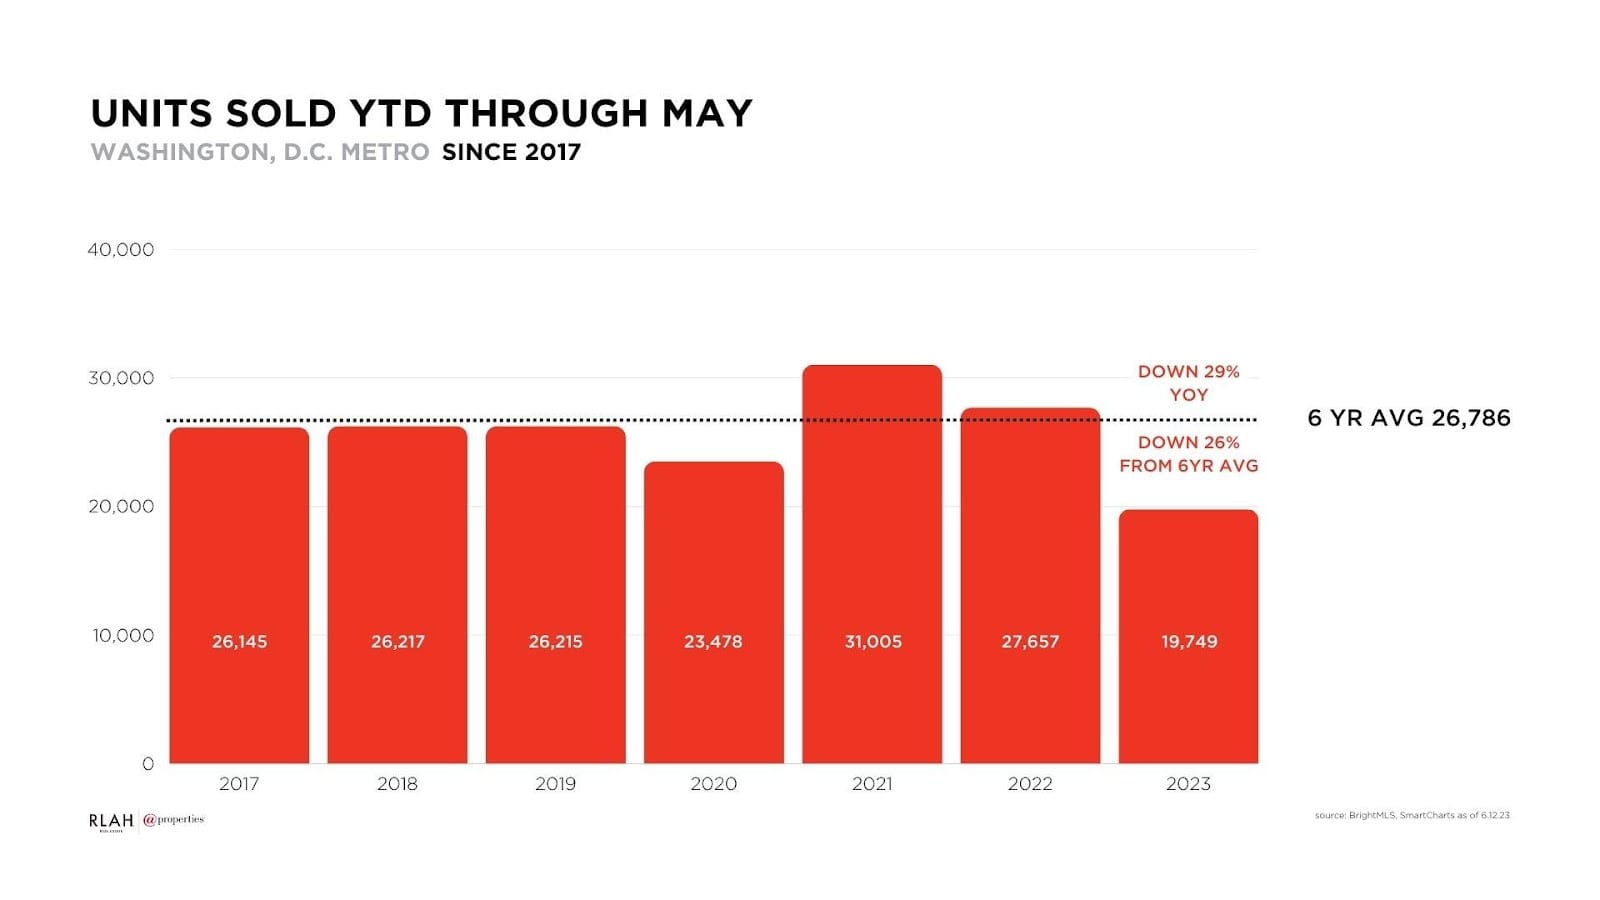
Chart #4: The result is about 26% fewer people have gotten to buy a home in 2023 than the 6-year average
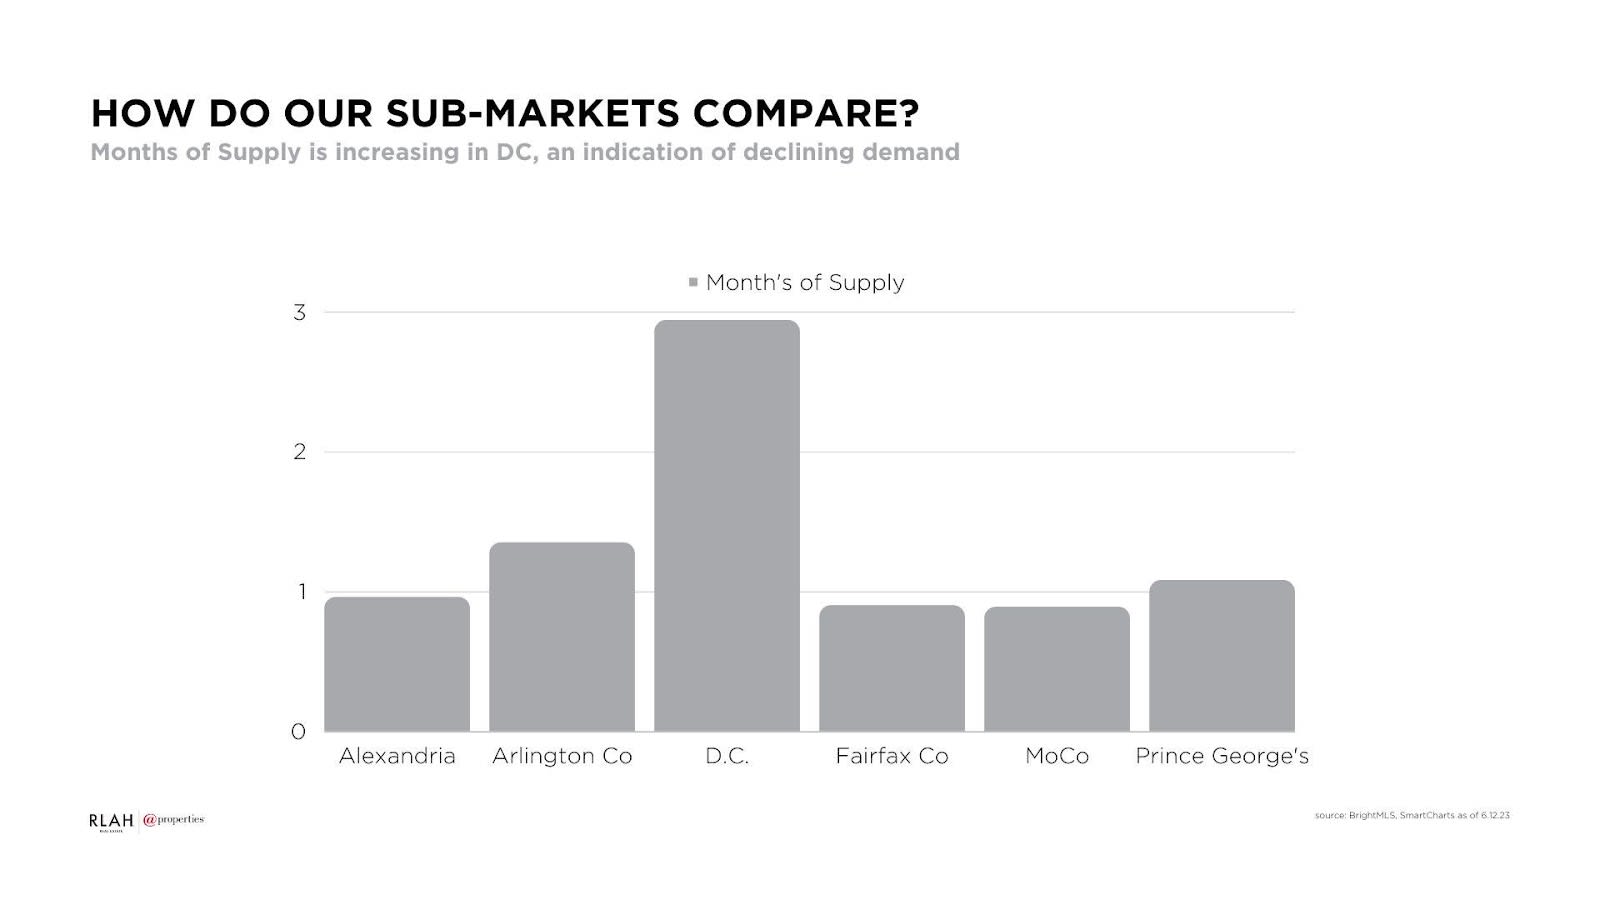
Demand Declining Fastest in DC
Demand has fallen everywhere compared to 2021/early 2022, but the drop in supply has been greater in most sub-markets than the drop in demand, which has kept market values up. However, Months of Supply, a metric that measures demand against supply, is on the rise in DC indicating that demand is falling faster than new listing volume and putting light downward pressure on prices.
Despite the increase in Months of Supply for DC, it’s still below three months, which is a favorable seller’s market. A buyer’s market occurs when Months of Supply reaches 5-6 months.
Demand Down, Supply Down Even More, So Prices Are…
Depending on how you look at it and what sub-market you’re referencing, most prices can be considered flat or moderately up.
If your reference point is May 2022 to May 2023, you’ll find some sub-markets with prices slightly down. A lot of that has to do with the fact that closings in May 2022 were made up mostly of contracts in March/April 2022 which was the peak of the COVID market insanity with low rates and surging demand.
If your reference point is a bit wider and includes data from earlier or later in 2022, you’ll see many prices are trending up through 2023.
Condo prices are up 6.2% year-over-year in the DC Metro, whereas single-family detached are down -2% year-over-year because the May 2022 condo market was still softer due to COVID-related shifts in demand (dropped for condos) and supply (huge condo sell-off) while the single-family detached market was on fire during at that time.
If you’d like to discuss buying, selling, investing, or renting, don’t hesitate to reach out to me at [email protected].
If you’d like a question answered in my weekly column or to discuss buying, selling, renting, or investing, please send an email to [email protected]. To read any of my older posts, visit the blog section of my website at EliResidential.com. Call me directly at (703) 539-2529.
Video summaries of some articles can be found on YouTube on the Ask Eli, Live With Jean playlist.
Eli Tucker is a licensed Realtor in Virginia, Washington DC, and Maryland with RLAH Real Estate, 4040 N Fairfax Dr #10C Arlington VA 22203. (703) 390-9460.