Question: How did Arlington’s single-family home market perform in 2021?
Answer: Last week we reviewed the performance of the condo market so this week we will take a look at the market that has been a topic of conversation across the country for well over a year – the single-family (detached) housing market.
Appreciation Was Strong, Not Exceptional
The 2021 Arlington single-family market was fiercely competitive and experienced its highest appreciation in years. However, the shift in market conditions (demand and price appreciation) was not nearly as dramatic as other regional or national markets that have made headline news over the last 12+ months.
Why? Thanks to strong market fundamentals and Amazon’s 2018 HQ2 announcement, the Arlington market was already exceptionally competitive and expensive, relative to most other regional and national markets, before the COVID-driven housing market mayhem.
Here are some highlights from the chart and table below (22206 and 22209 are not included due to the lack of single-family homes sold):
-
The average and median price of a single-family home in Arlington increased in 2021 by 6.2% and 7.2%, respectively. Excellent appreciation for any homeowner, but not the double-digit appreciation other regional and national markets experienced last year.
-
Nearly 50% of homes sold for more than the asking price and didn’t last more than one week on the market
-
More single-family homes were listed and sold in 2021 than any of the last five years. Had supply been closer to the ~1,000 homes sold in the previous three years, I suspect average and median prices may have climbed closer to double-digit year-over-year increases.
-
The median price of a house in Arlington exceeded $1M for the first time in 2021. The average price climbed above $1.2M in 2021 and has been above $1M since 2018.
-
The average buyer paid 1.1% over the asking price, which equates to about $13,000 over ask.
-
Of the homes that went under contract in one week or less (just under half), the average buyer paid 3.7% over the asking price
-
In 2017, the majority of homes (39%) sold for less than $800k, in 2021 just 15% of homes sold for less than $800k (this includes teardowns) and 19% sold for at least $1.6M.
-
In each of the last three years, over 40% of homes have sold for $800k-$1.2M


Shake-up at the Top of the Zip Code Rankings
We have a new clubhouse leader in the highest average sold price by zip code! With a 15% year-over-year increase in average price, 22213 (western Arlington) finished 2021 with the highest median and average sold price.
But wait, it gets even more interesting! Despite boasting the highest median and average price, the 22213 zip code has the lowest average $/SqFt, 4th lowest cost per bedroom, highest average year built by 10+ years, and tied for the largest average lot size. So depending on how you look at it, 22213 is the most expensive or best value!
It’s also worth noting that 22213 has the fewest sales of the zip codes I included, with barely enough total sales for me to be comfortable using it here.
The 22201 zip code, which surrounds the Rosslyn (well, Courthouse)-Ballston Corridor, commands the most money for the least house and yard with by far the highest $/SqFt, $/Acre, and $/Bedroom.
Something I would like to highlight with the data below is that change in average price is not necessarily reflective of actual appreciation of individual homes. For example, while 22201 and 22202 show 1% and 3% year-over-year price change, homeowners in those neighborhoods can rest assured that their homes almost certainly appreciated more than that in 2021. The uncomfortably low change in average price can likely be attributed to the property mix that was sold in 2021 rather than actual appreciation. Real estate data can be difficult and full of caveats when you’re dealing with relatively small sample sizes.


New Construction, Expensive Homes Lead the Market
The average price of a new home increased 13.1% in 2021 and exceeded $2M for the first time. New homes are bigger than ever, with the average total finished square footage coming in at just under 5,300 SqFt and averaging 5.5 bedrooms with 5.1 full bathrooms (nearly one full bathroom for each bedroom).
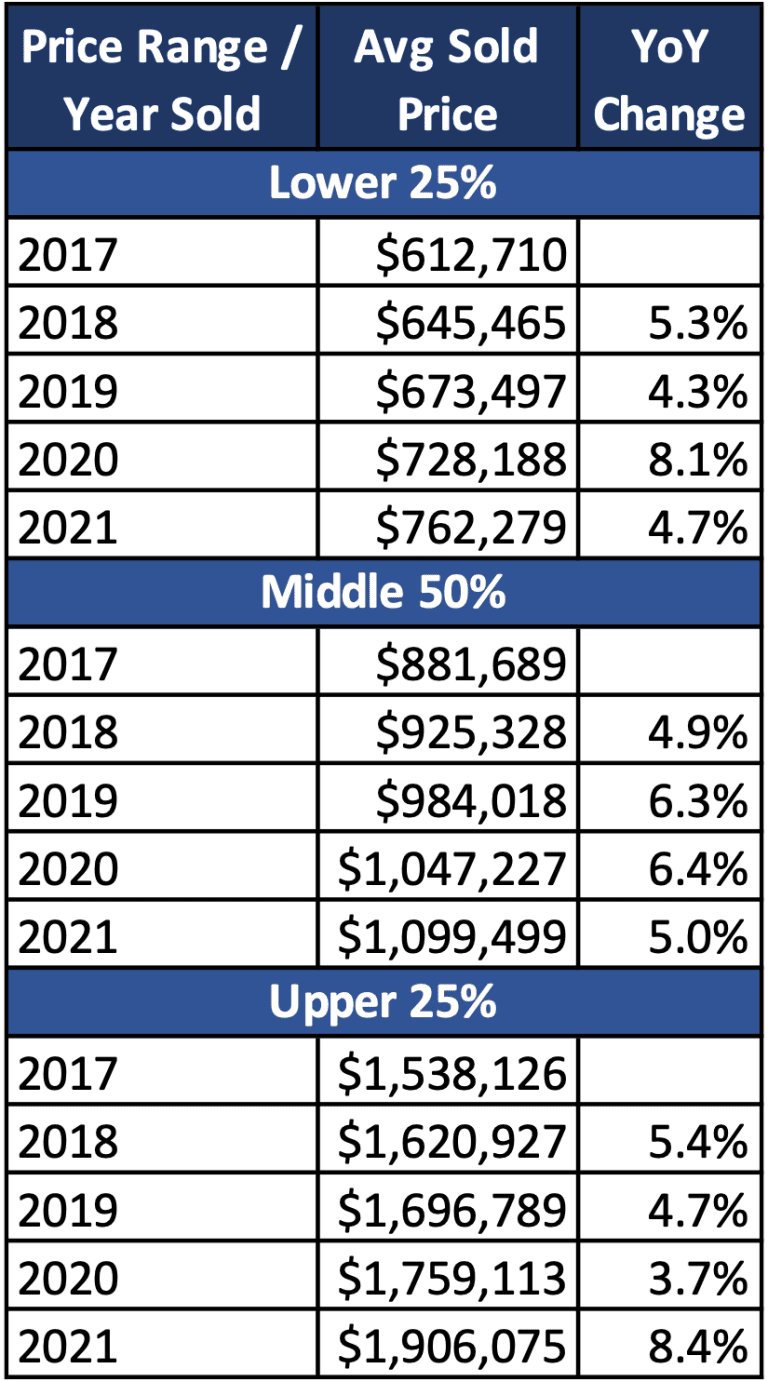
In the last table, I broke the market in each year down by price range (lower 25%, middle 50%, and upper 25%) to see how each cross-section of the market performed year-over-year. The 8.1% jump in the average price of the lower 25% in 2020 was likely due to the wave of people leaving shared living (apartments/condos) and the 8.4% increase of the upper 25% in 2021 is likely due to the increased demand of larger, new homes that offer more work-from-home and at-home schooling space for families and low-interest rates allowing buyers to increase their budgets.


If you’d like to discuss buying, selling, investing, or renting, don’t hesitate to reach out to me at [email protected].
If you’d like a question answered in my weekly column or to discuss buying, selling, renting, or investing, please send an email to [email protected]. To read any of my older posts, visit the blog section of my website at EliResidential.com. Call me directly at (703) 539-2529.
Video summaries of some articles can be found on YouTube on the Ask Eli, Live With Jean playlist.