Question: How did Arlington real estate do in the first half of 2017?
Answer: Market indicators at the beginning of the year were very strong. Spring purchase activity picked up earlier than usual in 2017 and all service providers I spoke to (contractors, landscapers, lenders, title companies, etc) all said business was thriving.
Now that we’ve made it through the first half of the year, let’s take a look at some key market indicators I like to use to determine how we’re doing relative to years past.
As usual, you’ll see some familiar customized stats from my previous posts:
-
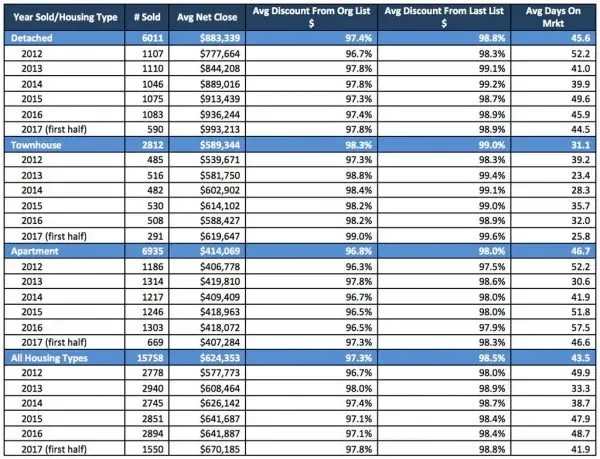
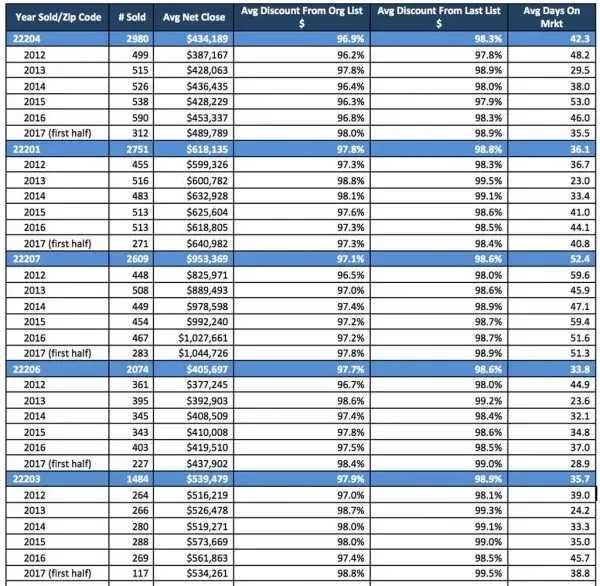
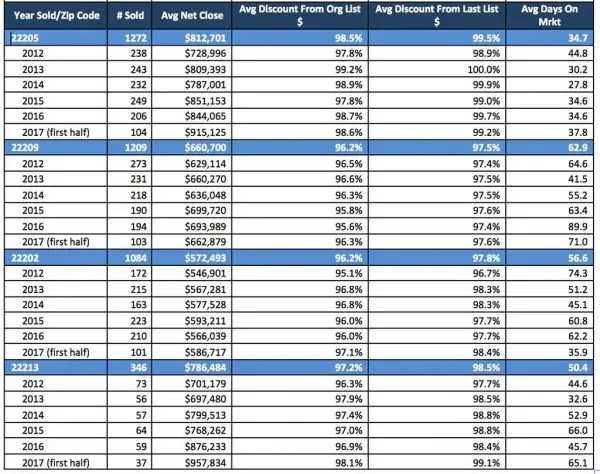
Avg Net Close: This is the sale price less any seller credits for the “true” sold price
-
Avg Discount from Org and Last List: One of my favorites — this is how much of a discount buyers negotiated from the original and last asking prices. A good indicator of who holds the most leverage in the market. 100% = buyer paid full price
-
Avg Days on Mrkt: How long it took for the seller to ratify a contract to sell, from the date they listed it for sale. A good indicator of the speed of the market and demand
-
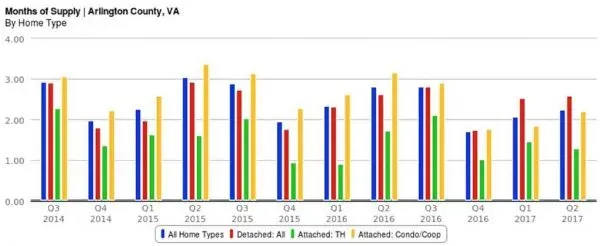
Months of Supply (chart): Economists will say that a balanced market has six months of supply. Anything below favors sellers and anything above favors buyers
Highlights
-
Arlington real estate prices are noticeably higher in most market segments, except apartments/condos (and in zip codes dominated by condo sales) where prices continue to stagnate
-
Nearly all markets show signs of upward pressure on prices with lower days on the market and smaller discounts from the original and last asking price
-
The average net selling price of detached (single-family) homes is way up, which is influenced by more sales of expensive new construction and off-market sales of cheaper tear-downs not showing up in the stats. However, it’s primarily due to the overall market for detached homes picking up, as seen by strong numbers in zip codes with few new construction sales
With that, I’ll let you smart folks dig into the two tables and one chart yourselves and draw your conclusions. Feel free to reach out to discuss anything you’re seeing, ask for more granular data for your home/neighborhood, or for help interpreting the data.
Stats By Housing Type
Stats By Zip Code
Months Of Supply