Question: I found data that shows housing prices in DC are back down to the 2018 levels but anecdotal evidence suggests they are not. Can you explain whether the data I found is accurate or something is off?
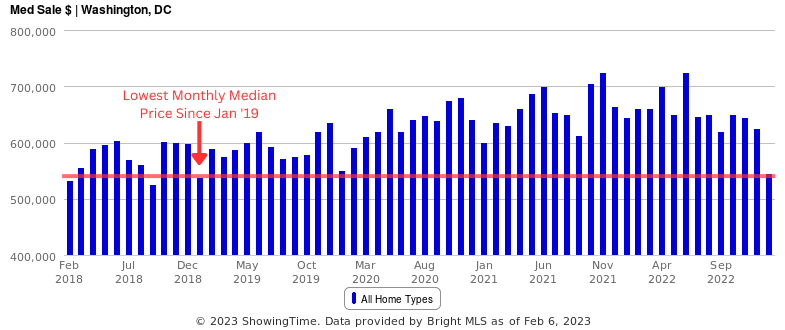
Answer: The median price ($545,500) for homes sold in January ’23 in Washington DC showed a 15.4% year-over-year drop and was the lowest median price for any month going back to January ’19.
Did DC Lose Four Years of Appreciation?
Given the economic and real estate climate since this summer, with endless headlines about market corrections, it would be easy to interpret the latest DC median price data as proof that the bottom is falling out of the real estate market. Unfortunately for our bear-market prognosticators, or those waiting for a market crash to buy property, the chart above is misleading and not representative of the actual market.
The drop in median price is due to an unusual data set and does not mean that real property values have fallen 15.4% year-over-year and/or lost four years of appreciation.
How The Data Steers Us Wrong
Real estate data can be tricky to use correctly (aka draw accurate conclusions) so if you want to make data-driven decisions, make sure you are leveraging the right data and working with somebody who understands the strengths and weaknesses of real estate data in your local market. Here’s why the January median Washington DC pricing data steers us wrong…
Timing: Pricing data lags by about 30-60 days, meaning the pricing data published in January is mostly made up of contract activity in November/December and is thus an indication of what happened in the market, not what is happening in the market. November and December are traditionally the slowest months of the year, with the least demand and lowest volume of homes being listed for sale. Sellers during this time of year also tend to be under more pressure to sell.
Combine that with the market deceleration in the 2nd half of the year due to rapidly rising interest rates and it made for an unusually slow real estate holiday season.
By the time the January pricing data was published in early February, market demand had already picked up significantly.
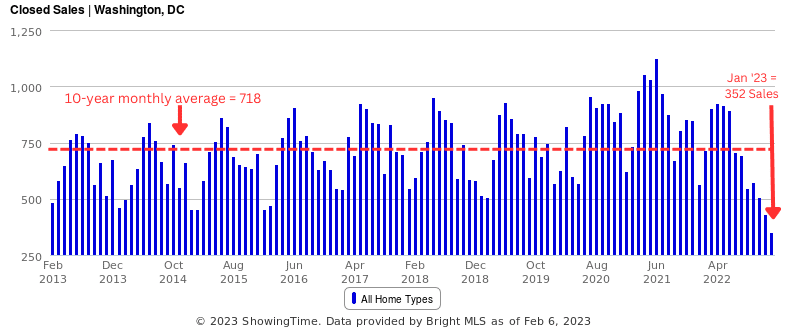
Sales Volume: Only 352 homes sold in DC in January compared to the 10-year monthly average of 718. Other than December ’22 (432 sales), no other month for the past 10+ years had registered under 450 sales, and only five months registered less than 500 sales.
The unusually low sales volume means that the median price data can be skewed by unusual balances of less (or more) expensive homes in a given month, which is why most January pricing data comes in much lower than other months and why January ’23 was such an extreme version of that scenario.
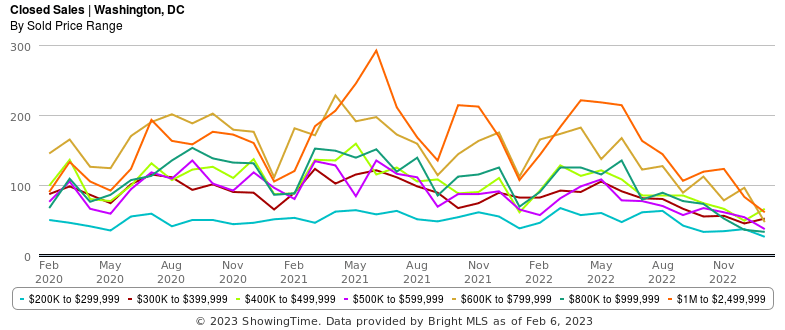
There were just 46 single-family homes in the January data. As you can see from the chart below that shows the number of sales by price points, the distribution of sale prices skewed significantly lower in the January data with a big drop for $1M+ homes sold but a more consistent number of homes under $600k sold. This leads to a much lower median price but doesn’t mean home values are dropping, just that fewer expensive homes were sold.
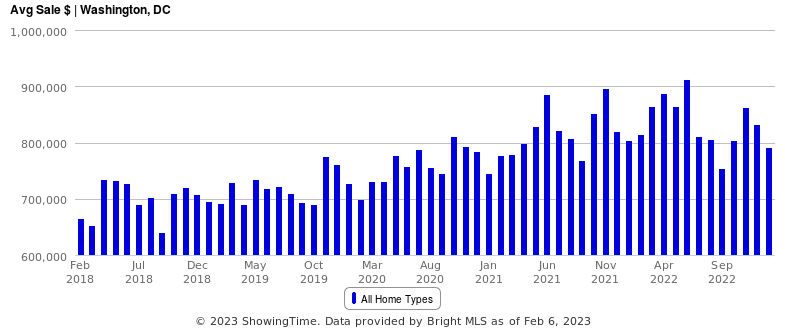
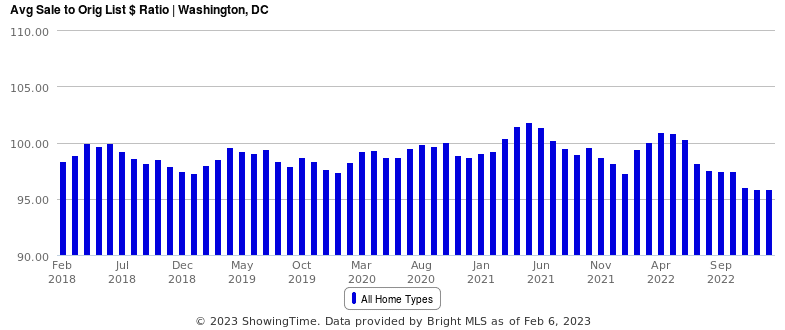
Average Price: The chart of monthly average prices tells a different story about price trends, showing a clear upward trend since 2019/2020. However, as you can see, using average price presents its own set of data challenges because of how much variability there is on a month-to-month basis based on the type/balance of sales included in the data for any given month.
Buyers Still Won During Q4
I’ve shown a bunch of reasons why the low median price for January sales wasn’t an accurate representation of the market (home values not down 15.4% year-over-year or to 2018-2019 levels), but I should still point out that it was objectively a more favorable time for buyers to negotiate better deals, just not to the tune of double-digit price drops.
The average home that sold in December ’22 and January ’23 sold for 4.2% less than the original asking price, which is pretty good when you consider the average home in the spring of ’22 was selling for nearly 1% over ask. In my opinion, this is the best measure of how much home values dropped from spring ’22 to November/December ’22, which is likely about 5%.
If you’d like to discuss buying, selling, investing, or renting, don’t hesitate to reach out to me at [email protected].
If you’d like a question answered in my weekly column or to discuss buying, selling, renting, or investing, please send an email to [email protected]. To read any of my older posts, visit the blog section of my website at EliResidential.com. Call me directly at (703) 539-2529.
Video summaries of some articles can be found on YouTube on the Ask Eli, Live With Jean playlist.
Eli Tucker is a licensed Realtor in Virginia, Washington DC, and Maryland with RLAH Real Estate, 4040 N Fairfax Dr #10C Arlington VA 22203. (703) 390-9460.