Question: How did the Arlington condo market perform in 2022?
Answer: Last week, I detailed the 2022 Arlington Single-Family market performance so this week we’ll do a deep dive into Arlington’s 2022 condo market performance.
Like the rest of the housing market, the condo market started the year off strong due to low interest rates and a return to more normal condo buying habits, after the flight from condos seen during the ’20-’21 pandemic years. Despite the interest-rate driven slowdown in the second half of the year, the aggregate performance of the condo market in 2022 was flat to slightly up, depending on how you look at the data.
The Condo Market Has Returned to Normal
What is a normal condo market in Arlington? It’s hard to remember what a normal condo market looks like because we haven’t seen one since ~2017/2018. The market went red hot at the end of 2018 after the Amazon HQ2 announcement until being frozen by COVID in early 2020 and then from summer ’20 through 2021we saw a flood of condo inventory hitting the market as people left for more space, which kept prices from increasing like the single-family and townhouse market.
So what is normal? Normal is about 1-2% annual appreciation and an average over 30-45 days on market. When you strip out the gains related to more expensive new construction condos being sold and just look at resales of existing condos, you’ll see that the long-term norm for Arlington apartment-style condos is a modest 1-2% annual appreciation.
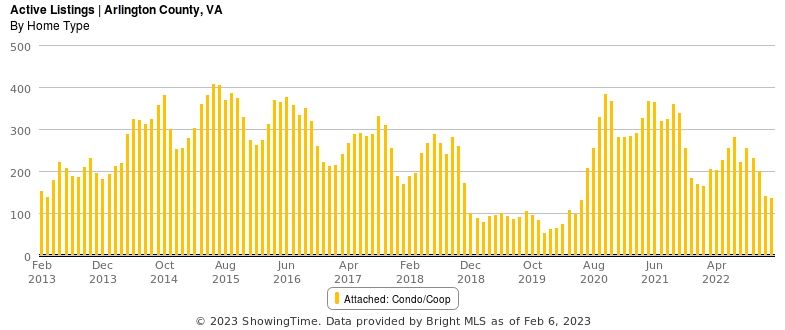
Except Inventory Levels
However, there are some signs that we might see stronger appreciation in 2023/2024 due the supply of condos for sale trailing well behind the 10yr average. The chart below highlights just how extreme the transitions were into the post-Amazon HQ2 announcement market (Nov ’18) and then into the COVID market. With a very weak pipeline of new condo deliveries in Arlington, supply will come from an already limited inventory of existing condos for sale and should create some upward pressure on pricing.
Data Highlights and Analysis
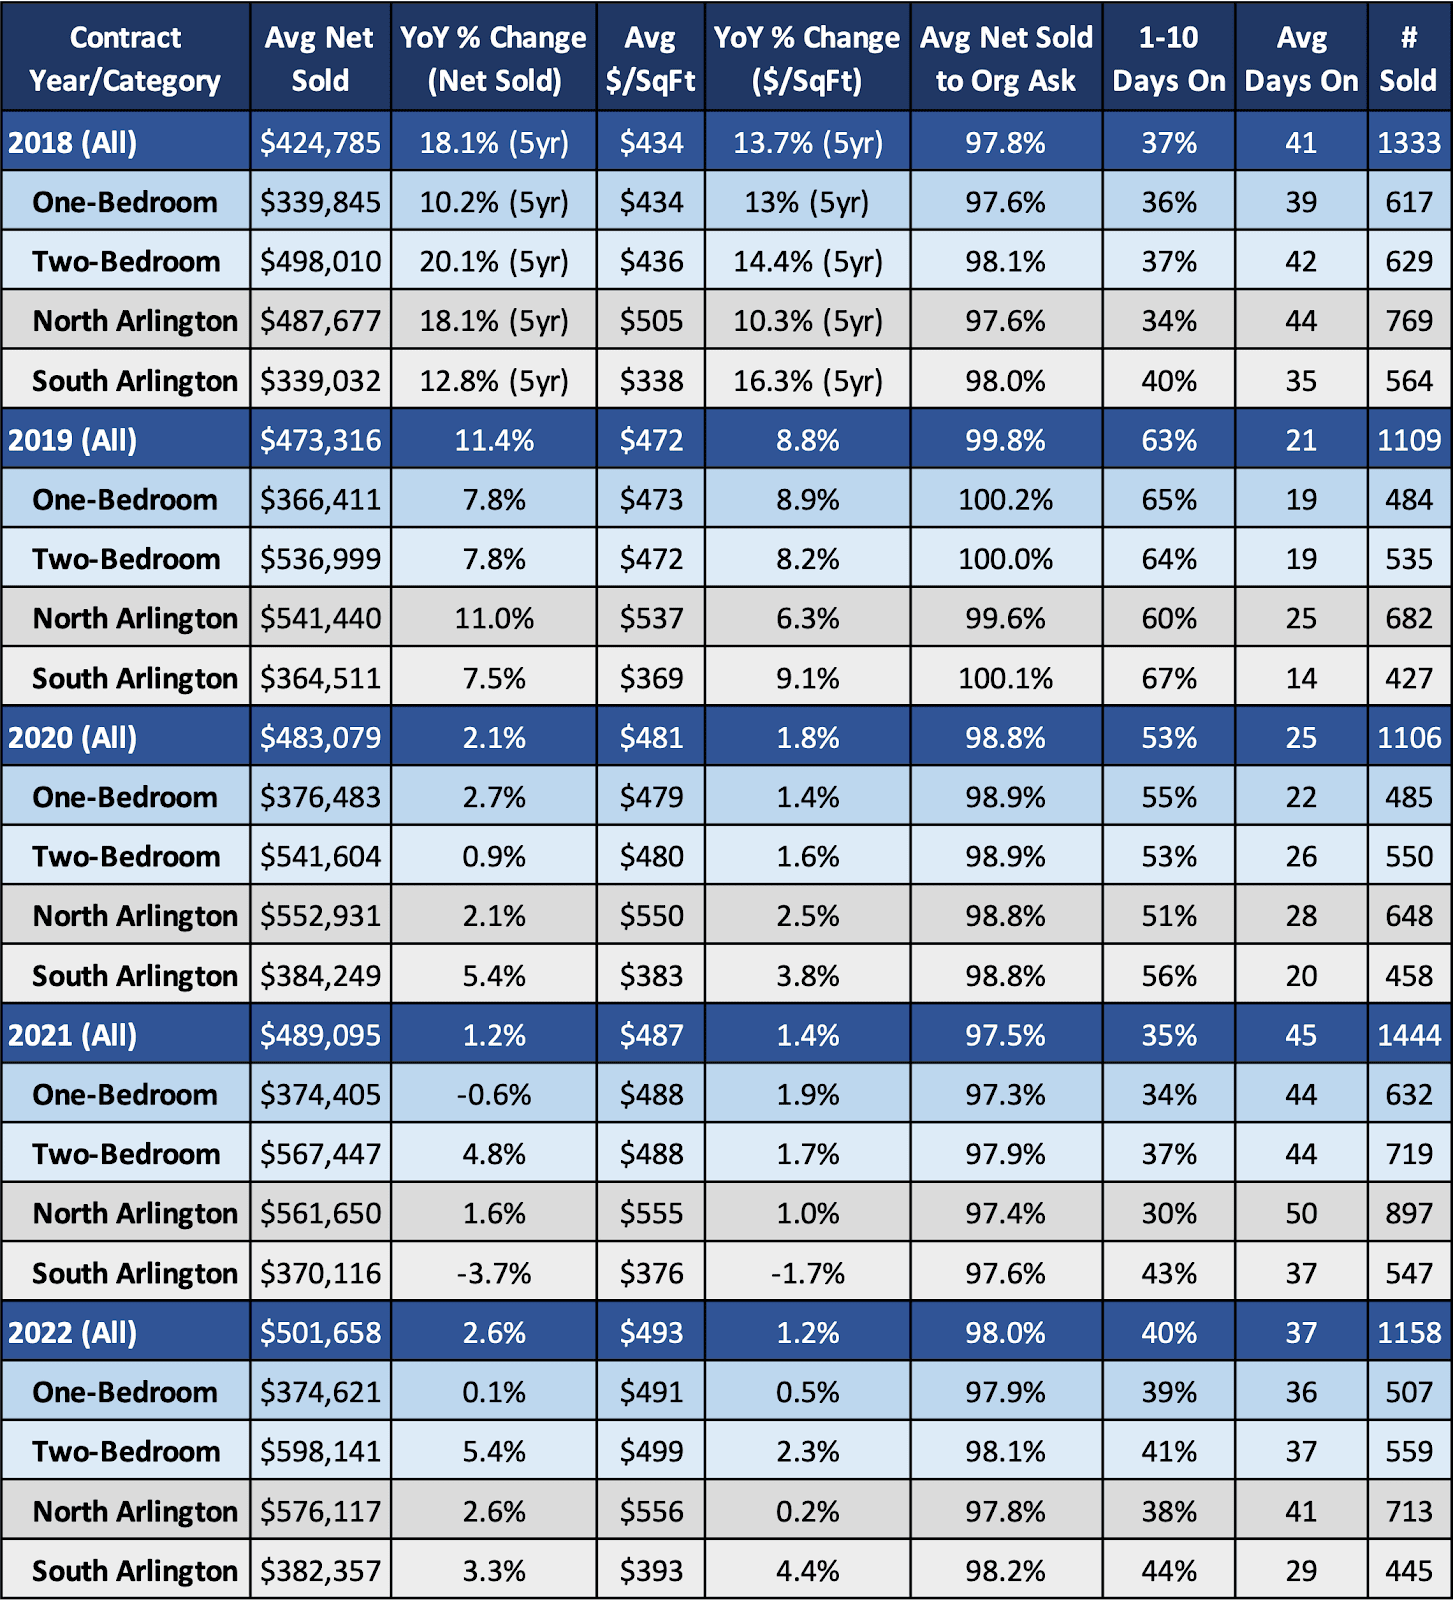
The following data is for apartment-style/multi-family condos (aka buildings only, exlcuding townhouse-style condos like you see in Fairlington) and does not include age-restricted condos (The Jefferson) or Coops (Riverplace). All prices are based on net sold price (purchase price less any seller-paid closing cost credits):
- The average price of an Arlington condo increased by 2.6% to $502,000 and the median price increased 1.7% to $427,000. If you remove new construction sales from the data, the average price increased by only .6% to an average price of $463,000.
- The average 1BR condo increased .1% with new construction included and .7% without new construction included. The average 2BR increased 5.4% with new construction as opposed to just 1.3% without new construction (2000 Clarendon had a lot of 2BR units).
- Since 2018 (five years), condos have appreciated by just 10-20%, depending on the sub-market you’re looking at and data you’re using, and almost all of that growth came in the ~12-14 months between the Amazon HQ2 announcement and COVID lockdowns. That appreciation drops by almost half when you remove new construction from the data. Single-family homes have appreciated about 2-3x+ faster over the last five years.
- Most of the 5yr price appreciation of the 2BR and North Arlington market segments is due to higher priced new construction buildings that have come online during that time and not actual price growth. When removing new construction, the 5yr growth for a 2BR drops from 20.1% to 10.5% and for North Arlington from 18.1% to 9.9%.
- Over the past five years about 2% of condo sales have been studios (no legal bedroom), 39% 1BR, 51% 2BR, 8% 3BR, and ~.5% have been 4+BR.
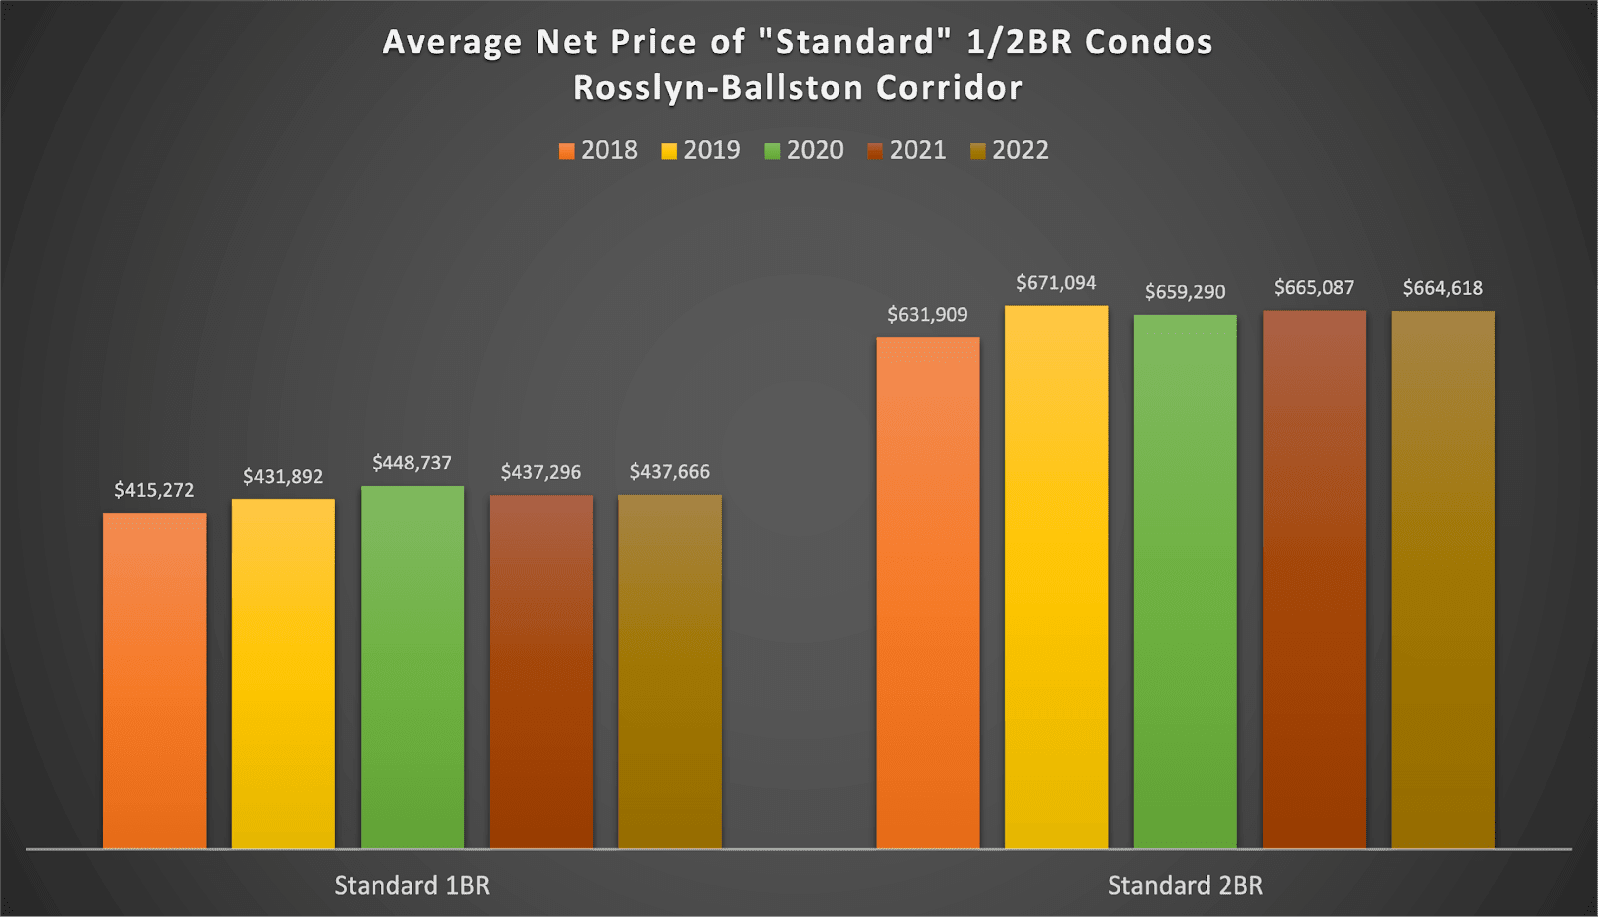
“Standard” Condos in Rosslyn-Ballston Corridor Haven’t Budged
A lot of similar condo inventory was built in the early 2000s along the Rosslyn-Ballston corridor so it gives us a unique opportunity to look at a large, relatively similar data set. The chart below looks at net sold prices of 650-800 SqFt 1BR and 900-1200 SqFt 2BR condos that were built between 2000 and 2010 along the R-B corridor. This sub-market makes up about 11% of total condo sales in Arlington over the past five year.
Since the Amazon HQ2 driven appreciation from 2018-2019, the value of these condos has barely moved and in the case of the 2BRs, the average net price has actually fallen slightly each year since 2019. I expect appreciation to look better over the next five years, barring any jarring market forces like COVID.
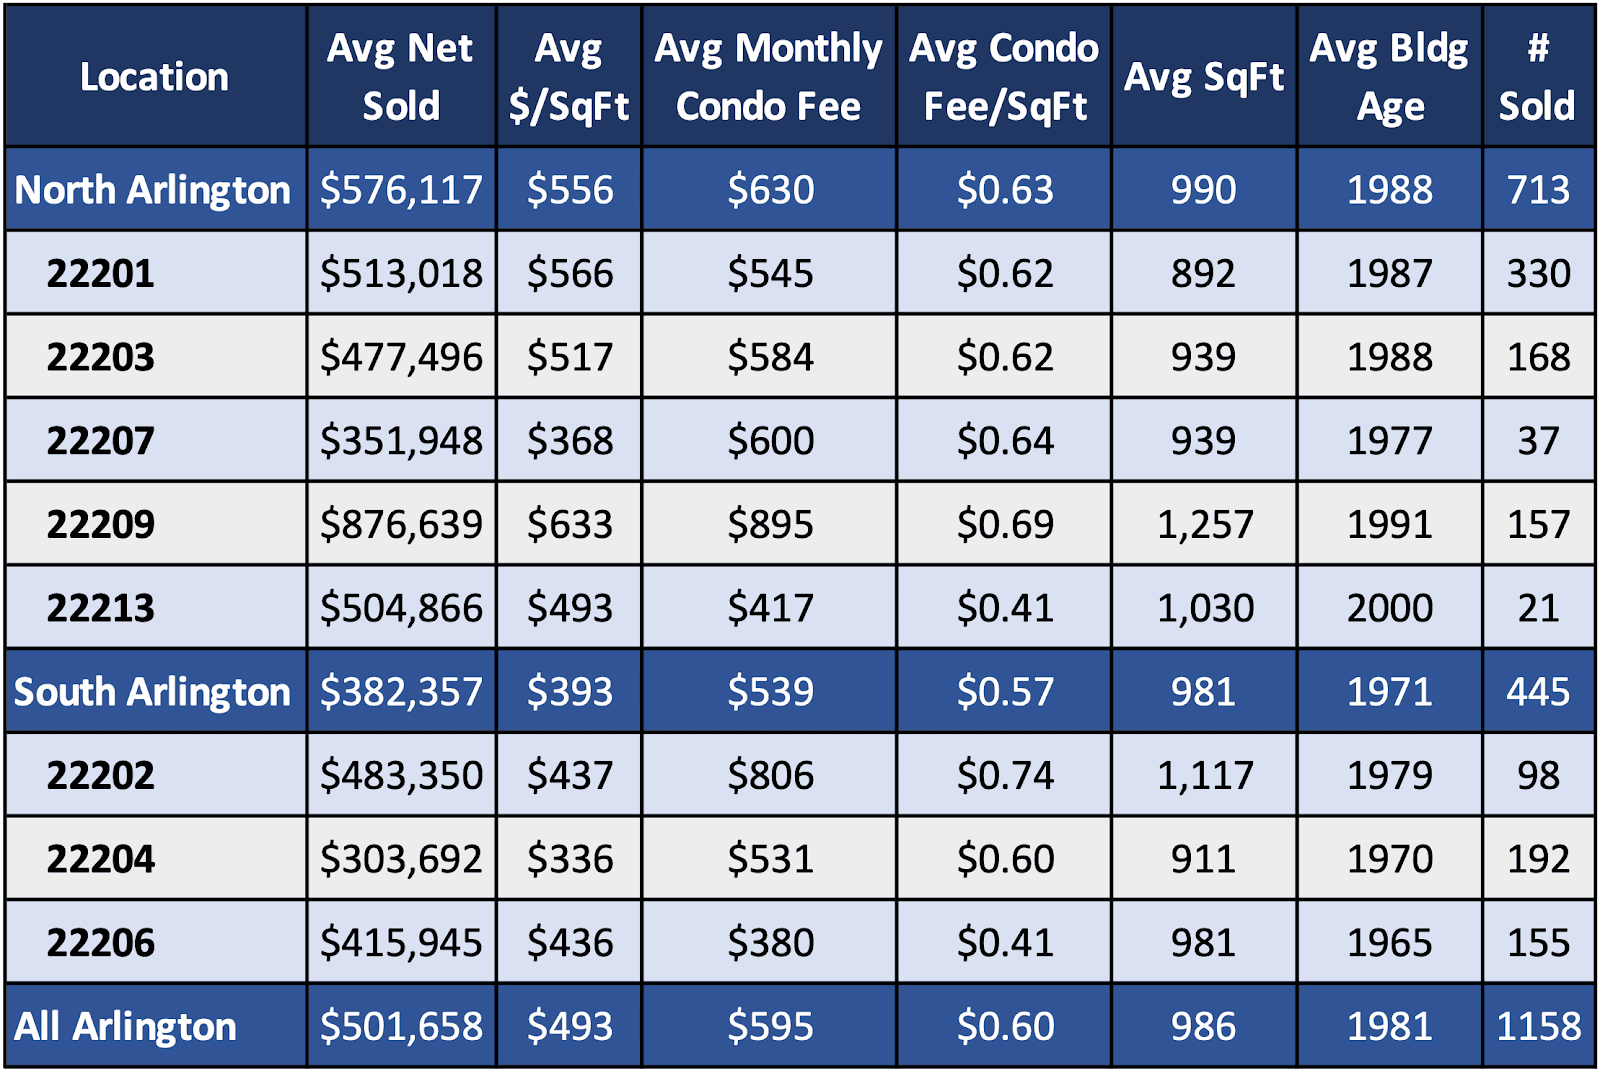
Condo Market by Zip Code
- The Rosslyn market, carried by luxury buildings like Turnberry, Waterview, Wooster and Mercer Lofts, Gaslight Square, and the newly built Pierce, is the most expensive zip code for condos by a significant margin.
- For those looking to snag a piece of real estate near Amazon HQ2, condos in the 22202 zip code are still reasonably priced but come at a cost of the highest monthly condo fee per square foot in Arlington.
- 22207, one of the most expensive zip codes for single-family homes, is the second lowest $/SqFt of any zip code for condo purchases. This will probably be a deterrent for developers of Missing Middle who are considering building 5-6 unit multi-family buildings vs townhouse-style duplex/triplex properties.
If you’d like data pulled for a sub-market you live in or are considering buying into, don’t hesitate to reach out!
If you’d like to discuss buying, selling, investing, or renting, don’t hesitate to reach out to me at [email protected].