Question: How did Q1 compare to other quarters and what does that mean for Q2?
Answer: The housing boom has been front-and-center in the national news cycle for about six months now and Q1 blessed many homeowners and builders with amazing results, while inflicting similar levels of frustration on buyers.
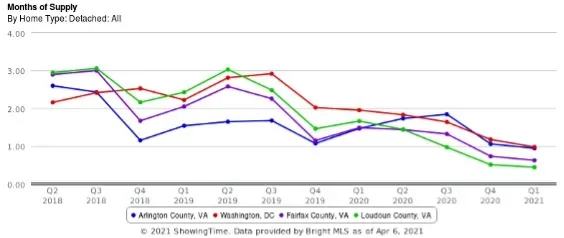
Despite the national, regional, and local craziness the Arlington single-family home (SFH) and townhouse (TH) markets actually didn’t look that different in Q1 2021 compared to the last couple of (post-Amazon HQ2) years so the pandemic-related housing boom hasn’t created nearly the systemic shock here as it has in other local markets like Fairfax County and Loudoun County. Months of Supply (measure of supply and demand) for SFH is down 36% YoY for Q1 in Arlington, but over 50% in Washington DC, Fairfax County, and Loudoun County with Loudoun County SFHs down an incredible 73.9% YoY in Q1.
Arlington Quarterly Market Performance
First, let’s take a look at a breakdown of the Arlington SFH/TH quarterly market performance, with some highlights bulleted below:
- If you’re buying an SFH/TH that has been on the market for 10 days or less, prepare to pay an average of 2-3% over the asking price. 12% of buyers since 2020 have paid 5% or more over the asking price.
- Since 2020, about two-thirds of SFH/TH properties go under contract in 1-10 days and only 21% have stayed on market for more than 30 days.
- You can expect price escalations on hot properties to be even further above the asking price in Q2 compared to Q1, based on historical data. The only exception to this was in 2020 because Q3 functioned like Q2 due to a delayed spring market caused by the pandemic.
- Expect about one-third of 2021’s SFH/TH properties to be listed for sale in Q2, the most of any quarter by a significant margin.
- Among SFH/TH properties that went under contract in 1-10 days in Q1, the average sold price of those homes increased 11.8% over Q1 2020. Last year there was a 5.7% increase in average sold price of hot properties compared to Q1 2019.
| Contract Year/Quarter | Avg Sold to Org Ask (Properties 1-10 Days On) | % 1-10 Days on Market | Listing Volume | Listing % of Annual Total |
|---|---|---|---|---|
| 2016 | 100.7% | 38.8% | 1640 | 100% |
| Q1 | 100.7% | 38.9% | 405 | 25% |
| Q2 | 101.0% | 46.6% | 555 | 34% |
| Q3 | 100.4% | 34.0% | 402 | 24% |
| Q4 | 100.2% | 31.3% | 278 | 17% |
| 2017 | 100.9% | 41.0% | 1744 | 100% |
| Q1 | 101.0% | 47.1% | 487 | 28% |
| Q2 | 101.3% | 46.1% | 587 | 33% |
| Q3 | 100.7% | 36.5% | 415 | 24% |
| Q4 | 100.1% | 28.4% | 255 | 15% |
| 2018 | 101.1% | 43.0% | 1614 | 100% |
| Q1 | 101.2% | 50.4% | 400 | 25% |
| Q2 | 101.5% | 48.1% | 549 | 34% |
| Q3 | 100.9% | 39.4% | 390 | 24% |
| Q4 | 100.5% | 31.3% | 275 | 17% |
| 2019 | 101.9% | 56.9% | 1451 | 100% |
| Q1 | 101.8% | 63.4% | 389 | 27% |
| Q2 | 102.2% | 61.0% | 478 | 33% |
| Q3 | 101.9% | 54.6% | 346 | 24% |
| Q4 | 101.1% | 43.8% | 238 | 16% |
| 2020 | 102.2% | 59.5% | 1600 | 100% |
| Q1 | 102.4% | 65.4% | 356 | 22% |
| Q2 | 101.8% | 58.1% | 399 | 25% |
| Q3 | 102.7% | 63.9% | 493 | 31% |
| Q4 |
101.9%
|
50.0% | 352 | 22% |
| 2021 | 102.7% | 60.3% | ||
| Q1 | 102.7% | 60.3% |
Northern VA and Washington DC Market Performance Comparison
As noted earlier, the pandemic created a much sharper change in the real estate markets outside of Arlington because Arlington had already experienced similar changes due to Amazon’s HQ2 announcement in November 2018. Below are some charts comparing the SFH markets (and one comparing the condo markets) in Washington DC, Arlington, Fairfax County, and Loudoun County, with some highlights bulleted below:
-
In 2018 and most of 2019, Months of Supply for SFH in Washington DC, Fairfax County, and Loudoun County was 2-3x higher than Arlington (indicating a more favorable market for buyers). In Q1 2021, Fairfax County and Loudoun County had about half the Months of Supply as Arlington and Washington DC, clearly a sign of buyer preferences for more space, lower $/SqFt, and de-prioritization of commute time and walkability.
-
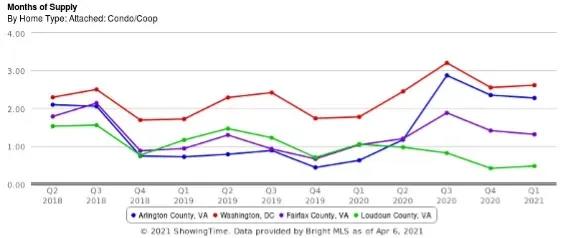
The most dramatic pandemic-related market shift for Arlington has been the condo market going from the most favorable market for sellers pre-pandemic to a near tie with Washington DC for least favorable, by a significant margin.
-
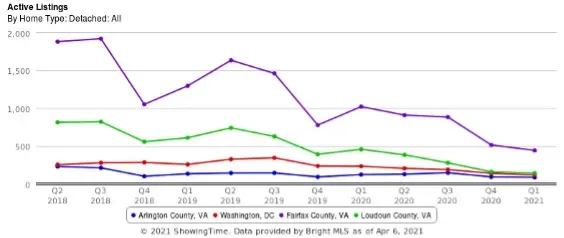
Fairfax County stands out for the huge drop in active SFH home listings, dropping from an average of nearly 2,000 listings/quarter in 2018 to less than 500 in Q1 2021.
-
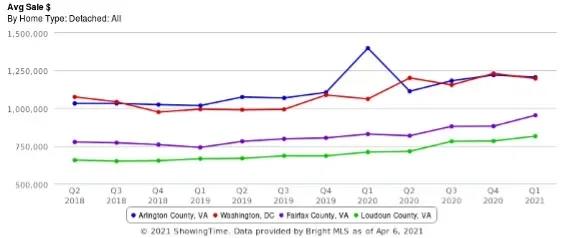
The data suggests relatively little change in average prices in Q1 2021 in Arlington and Washington DC, but I think this is more about the data composition than a reflection of actual pricing because everything I’ve experienced in the market suggests strong price growth in Q1 2021.
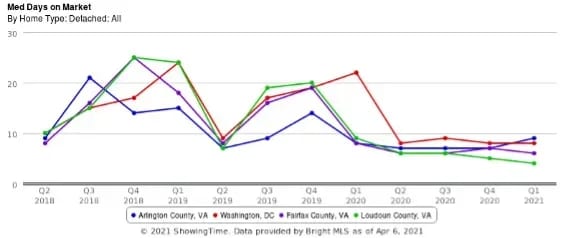
-
Median days on market for SFH has been below 10 days in all four markets since the pandemic began.
If you’d like to discuss buying, selling, investing, or renting, don’t hesitate to reach out to me at [email protected].