Question: Are you able to tell how much of the appreciation in the overall Arlington housing market is from homes in the upper or lower price ranges?
Answer: I’ve often wondered if the appreciation in Arlington’s housing market is driven more by the lower, middle, or upper end of the market. My theory, prior to doing an analysis, was that homes in the lower price ranges were appreciating faster than those in the upper ranges, thus affordability was suffering more than any other category of housing.
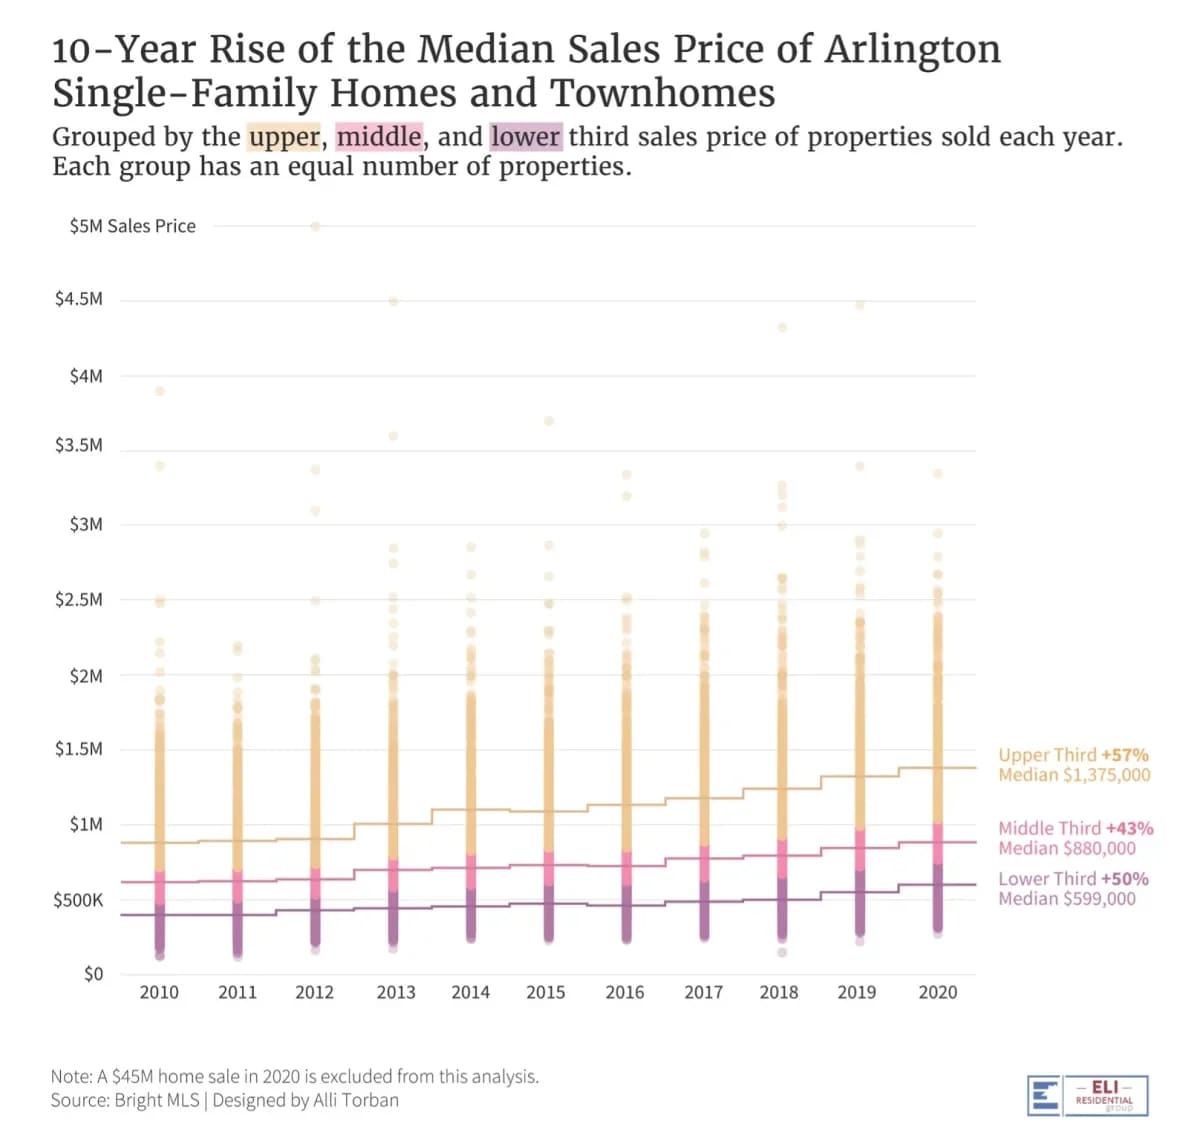
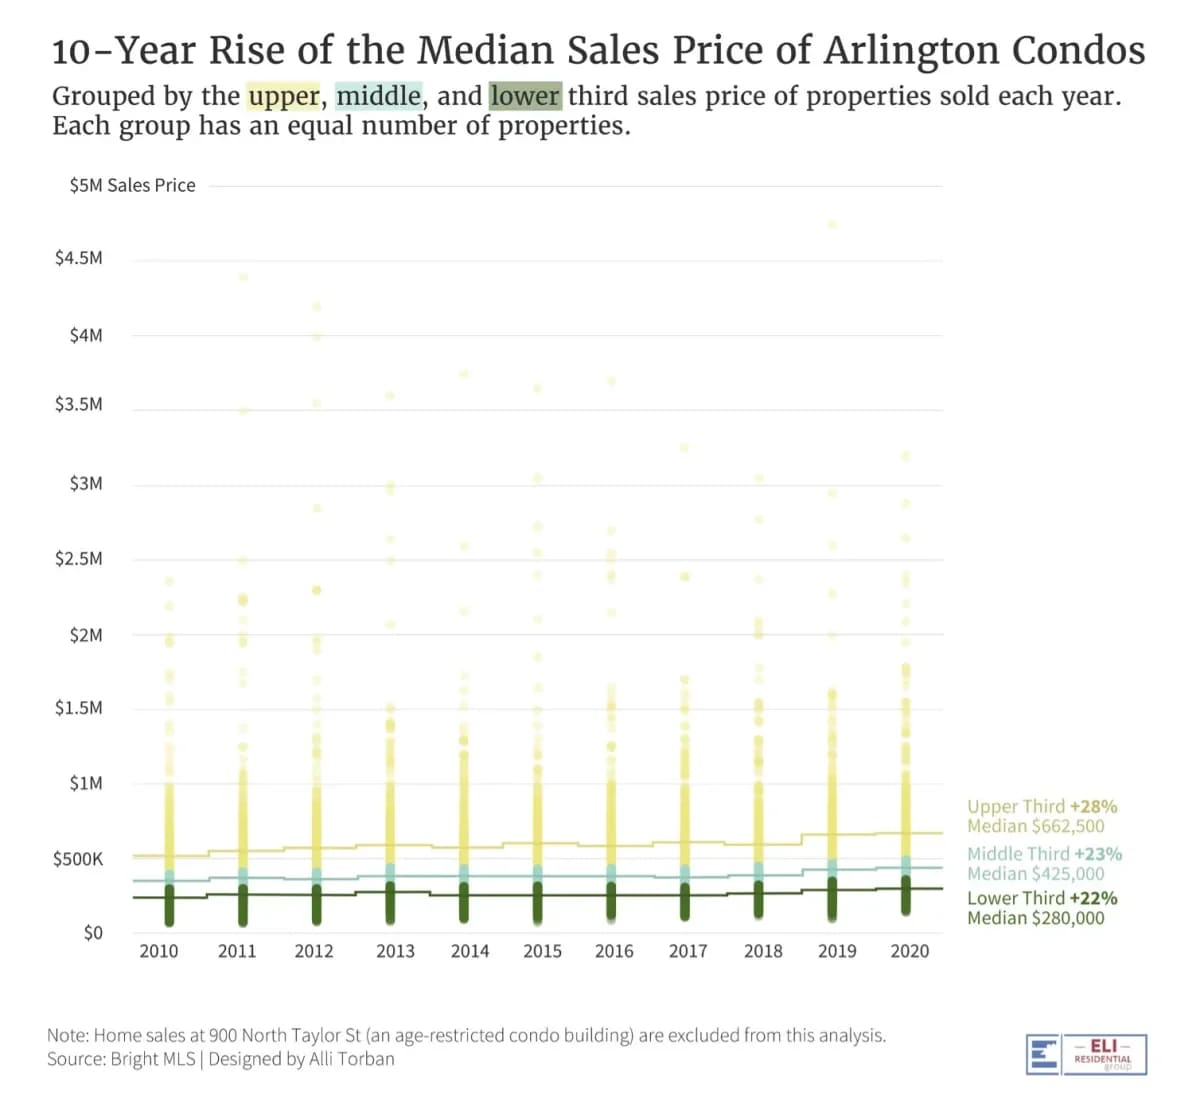
To test this theory, I split each year into a lower, middle, and upper third and found the median price within each price range (note: the numbers for average prices looked very similar). I split the market into single-family/townhouses and condos for a more accurate picture of actual market behavior.
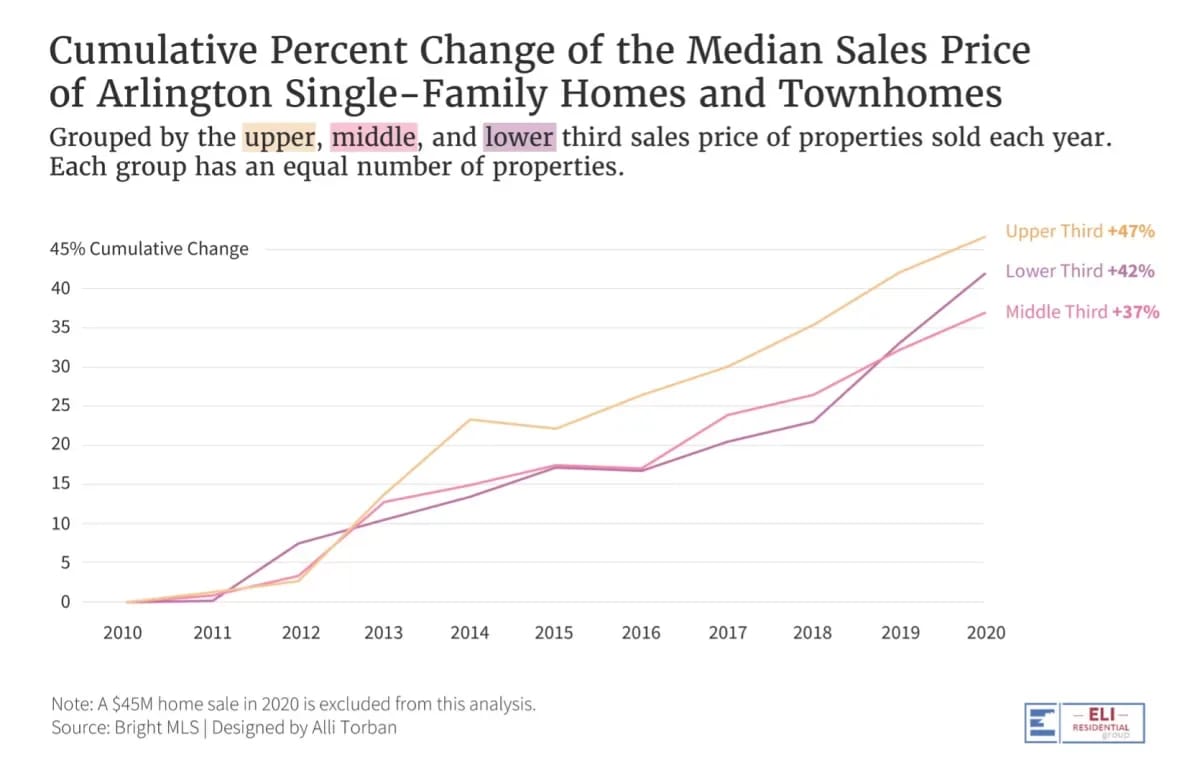
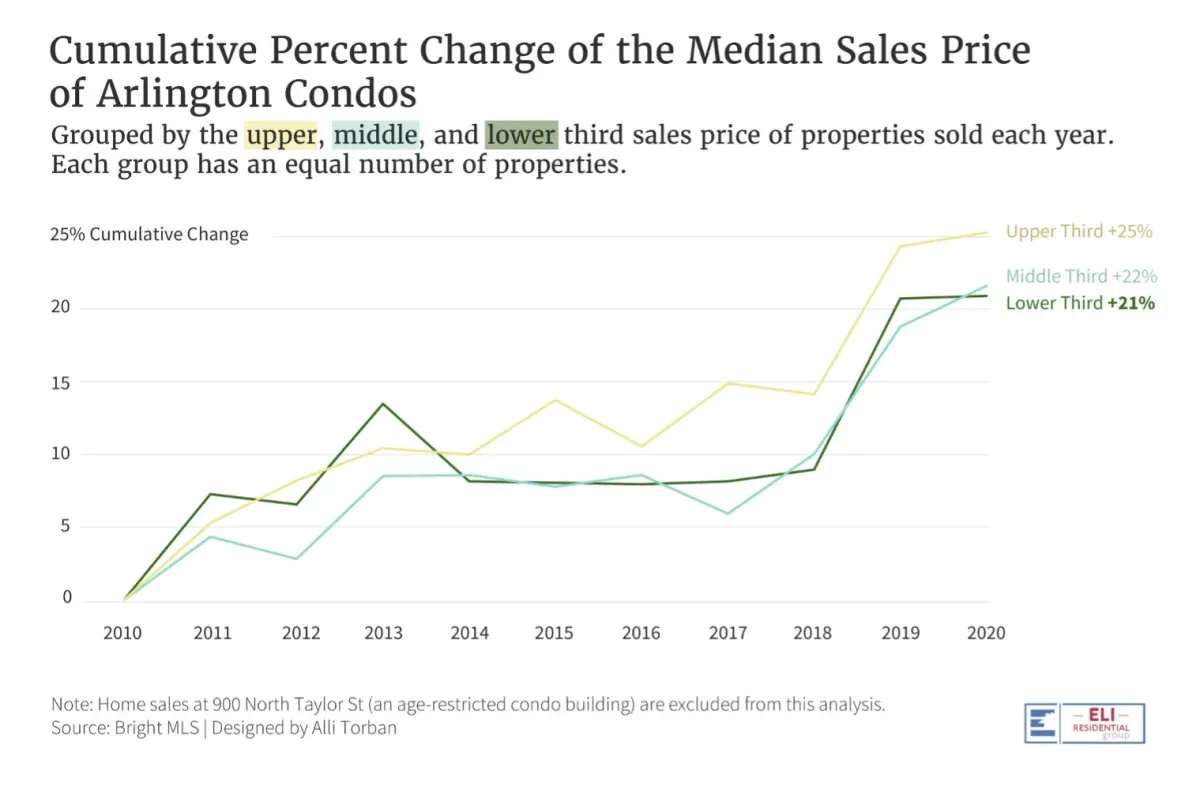
As it turns out, for the single-family/townhouse and condo markets, the upper third of the market has appreciated more over the last ten years than the lower and middle thirds. As is usually the case, single-family homes and townhouses appreciated much faster than condos during the same period, with single-family/townhouses practically doubling the rate of condo appreciation over the last ten years.
Explanation of Charts: Appreciation and Market Speed
Below you will see charts showing the median price of the lower, middle, and upper price tiers for single-family/townhouses and condos in Arlington over the last ten years. I also included a chart showing the cumulative appreciation for each price tier to highlight when each market experienced the greatest price jumps or most price stability.
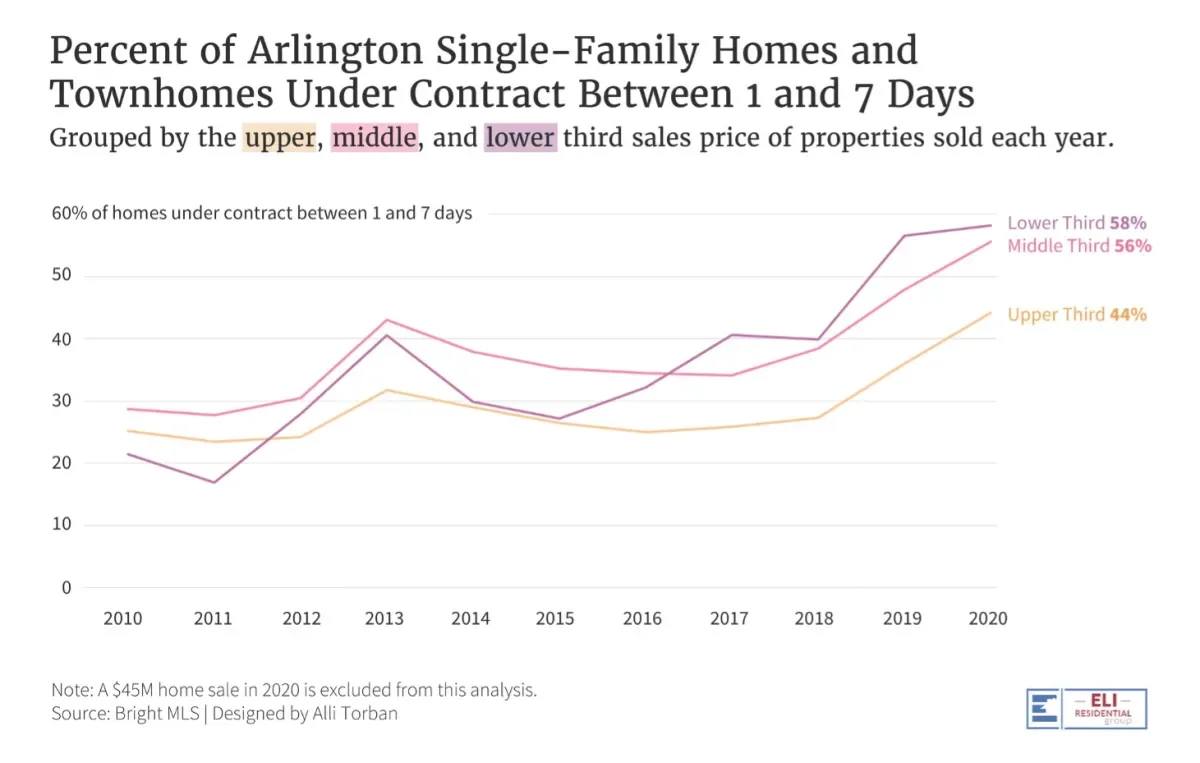
The last two charts show the same concept but applied to Days on Market. Specifically, looking at what percentage of homes went under contract within the first 1-7 days on market. I’ve always felt like this metric is one of the best ways to understand how fast the market is moving and the intensity of demand.
All three price tiers show similar speed/intensity of demand over the years, with the only noticeable different being the upper third of single-family/townhouses, which is likely skewed by new construction, which often has a much higher days on market because of how often homes are listed before they’re finished.
I hope you find these charts as interesting as I do! If you’d like to discuss buying, selling, investing, or renting, don’t hesitate to reach out to me at [email protected].