Question: How did the Arlington real estate market perform in the first half of 2019?
Answer: I am excited to announce the first of many collaborations with Jeannette Chapman, Deputy Director and Senior Research Associate, at the Stephen S. Fuller Institute at George Mason University to bring you deeper, more insightful analysis of the Arlington housing market. The Fuller Institute conducts incredible research and analysis on the Greater Washington regional economy and I’d encourage you to subscribe to their monthly Washington Economy Watch reports. Jeannette is an Arlingtonian and housing data junkie, which means even better market insights for ARLnow/Ask Eli readers!
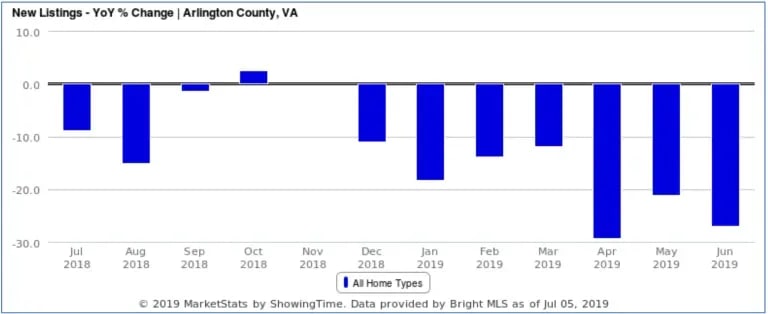
Inventory Down, Prices Up
Amazon announced they were moving their second headquarters to Arlington in November 2018 and there has been year-over-year double-digit decreases in homes listed for sale in each of the seven months from December through June, topping out with a 29.5% drop in April 2019 compared to April 2018. I think this is due to owners deciding to hold out for more gains once Amazon employees start showing up.
The shortage in housing inventory forced buyers to compete for homes, resulting in 46.1% of homes selling for more than the asking price in the first half of 2019, compared to an average of 26.5% going over ask during the previous five years.
Less inventory combined with shifts in demand (buyers moving their timelines up and new investors entering the market) led to price increases across Arlington in the first half of 2019, compared to the first half of 2018, by an average of 4.6% and median 8.8%. This does not mean that all homes in Arlington are worth 5-9% more than they were this time last year – some sub-markets are up more while others haven’t experienced the “Amazon-effect” yet.
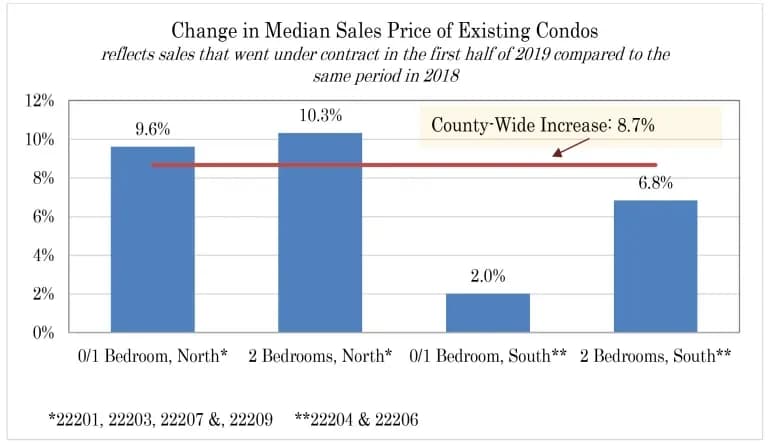
To get a more accurate picture of what’s happening in our housing market, we separated the data into smaller sub-markets. Townhomes aren’t included because there’s not enough volume to produce good data and we left out the 22202 zip code, which makes up the Crystal City/Pentagon City area (aka most of National Landing), because it’s a very different market than the rest of the County and requires its own analysis in a future column. We chose to remove new construction, age-restricted housing, and Cooperatives. Finally, the time period is based on when a property actually went under contract instead of when it closed.
Interpreting the Data
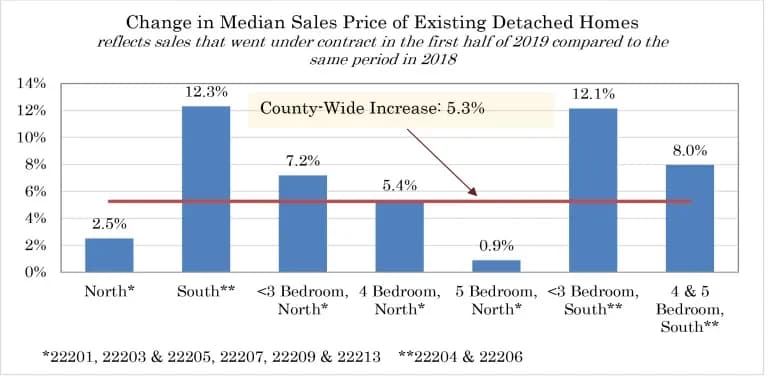
For the most part, the charts above reflect what I’ve experienced in the Arlington housing market this year so double-digit appreciation from South Arlington single-family detached homes and North Arlington condos makes sense. However, I was very surprised by the South Arlington condo data.My experience this year tells me that South Arlington condos have appreciated more than most Arlington sub-markets, with examples of units selling for 10-20% more than they would have last year. So why does the data show that 0/1BR condos in South Arlington are only up 2% compared to the first half of 2018? The make-up of the individual sales is different in 2019 and 2019 sales are down nearly 50%, meaning our sample size is too small.
During the first half of 2018, there were more expensive sales and fewer inexpensive sales, as a percentage of total sales, compared to the first half of 2019. Sales in 2019 have also been 32sqft smaller with 7% higher condo fees than the sales in 2018. These differences in the make-up of the data have skewed the median and averages in a way that doesn’t accurately represent what we’re seeing from individual sales.
The lesson? Real estate data is tricky and doesn’t always communicate what’s actually happening in the market (e.g. this June column about 17.3% appreciation in Arlington).
Historical Context
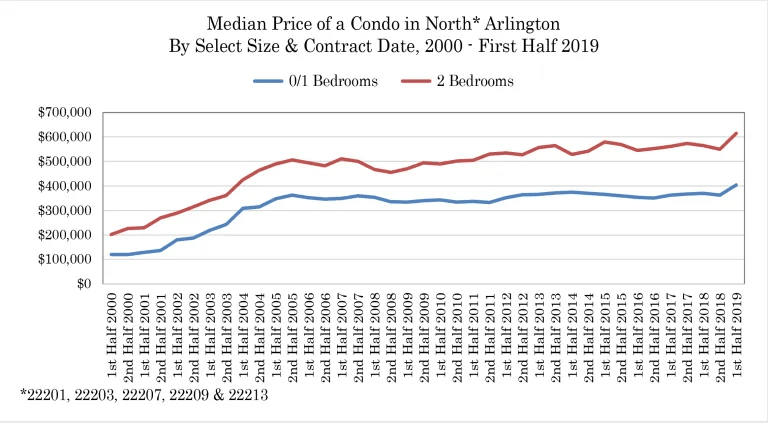
We took a look at the strongest performing sub-markets in the first half of 2019 to see how these gains look from a historical perspective, going back to 2000:- North Arlington condos show the biggest “Amazon-effect” with a sharp deviation from relatively stable prices over the last 10+ years. Note that existing condo sales dropped off more than the chart suggests during the recession, but the sales in newer, more expensive buildings helped maintain the market-wide median price.
- History suggests that the North Arlington condo market will level off and remain relatively stable at these prices. It’s easier to add new condo supply to the market compared to other housing types, so supply usually adjusts to meet demand.
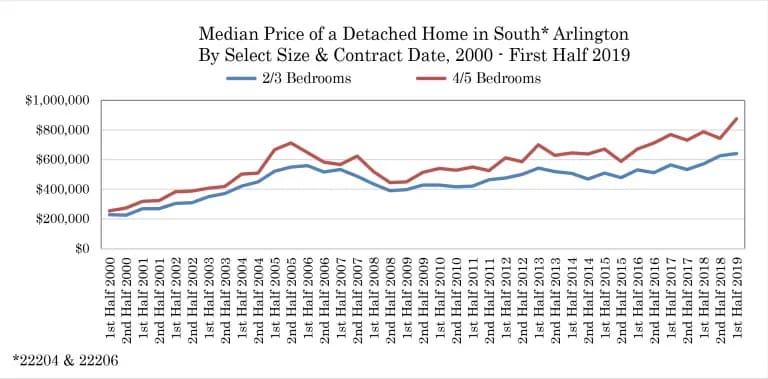
- Single-family detached homes in South Arlington received a noticeable boost from Amazon, but were already trending up over the last 3-5 years so the 12.3% gains are likely a combined effect
- Volatility in the South Arlington single-family detached market will likely continue for years to come as the area develops and the market finds a balance. I am bullish on most single-family detached housing in Arlington because it’s nearly impossible to add more supply to meet increasing demand.
Conclusions and Questions
There’s no doubt that Amazon has had a major impact on Arlington’s housing market already, but at this stage, it’s all speculative. Homeowners speculating they’re better off waiting to sell. Investors speculating that property values will appreciate. Home buyers speculating that they’re better of buying now.I expect the North Arlington condo market to taper off and provide owners with modest, long-term growth and believe the best days for North Arlington townhouse and single-family detached homes are 3-5 years out.
Even though the aggregate data doesn’t currently show double-digit growth in the South Arlington condo market, that’s what is actually happening (see earlier explanation). I think this, and the South Arlington townhouse/duplex market, will stabilize next year and provide modest, long-term growth. I wouldn’t be surprised if there was a pull-back in the South Arlington single-family detached market next year, but I think it has the most growth potential over the next 8-12 years, outside of the 22202 zip code. The ceiling for South Arlington will depend on the quality and pace of development along Columbia Pike, parts of South Glebe, and Nauck.
Some of the questions I have about the next 6-24 months in the Arlington housing market are:
- Will homeowners react to recent appreciation and take advantage of a “seller’s market” by putting more homes on the market in the next 6-18 months or will they continue to wait?
- Did 2019 cannibalize buyers who were planning a purchase/investment in 2020-2021 and will that demand be replaced with new buyers or will we see a drop in demand until Amazon hiring picks up?
- What decisions will the County make to increase density and will that provide for more townhouse/duplex development instead of just condos/apartments?
- How will the headwinds from a potential downturn in the US economy impact local real estate momentum?
- How much more will office vacancy rates drop and will another Fortune 500 company soon follow the lead of Nestle and Amazon?