Question: How did the Arlington real estate market perform in 2018 and what do you expect in 2019?
Answer: Over the last two weeks I reviewed how the detached single-family market and condo market fared in 2018 and this week we’ll take a look at the 2018 performance of Arlington’s townhouse and duplex market. Next week we’ll close out the four-part series with a detailed look into the data following Amazon’s HQ2 announcement.
Limited Price Growth, Strong $/SQFT Growth
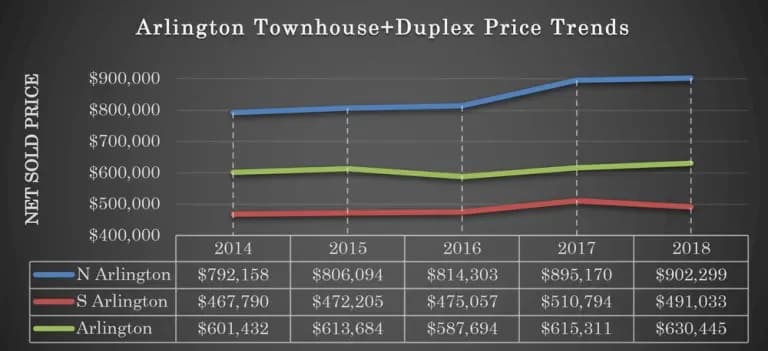
With prices surging in the detached single-family market in 2018 and in the condo market during the first half of 2018, one would expect a spike in townhouse prices. In reality, North Arlington prices increased by a meager .8% over 2017 and dropped by 3.9% in South Arlington for an overall 2.5% increase in the average net sold price of an Arlington townhouse/duplex. If we drill down a bit further into the data, it turns out that all of the growth occurred in the 2nd half of 2018 in N Arlington.
How do .8% growth and a 3.9% loss equal an overall 2.5% increase in pricing? Fair question…it’s because the volume of more expensive N Arlington homes increased significantly from 2017 and the volume of S Arlington homes dropped significantly from 2017, this caused N Arlington’s .8% to contribute much more heavily to the overall pricing.
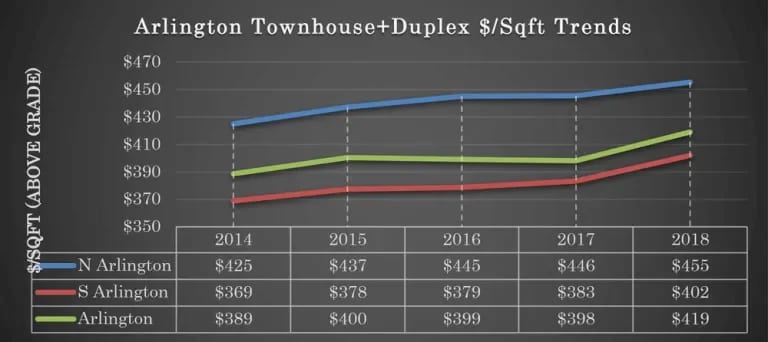
The sales price doesn’t tell the entire story though. When I looked at $/sqft (using above-grade square footage, no basements), I saw a different story unfold in 2018 with 5.3% growth across Arlington – 4.9% in S Arlington and 2.2% in N Arlington. Couple this data point with the fact that S Arlington townhomes sold three weeks faster than N Arlington’s in 2018 and S Arlington buyers negotiated .4% less off the original asking price than N Arlington buyers, I predict that the S Arlington townhouse market is poised for significant growth in 2019.
What’s the difference between what you get in N Arlington and S Arlington? Quite a lot when it comes to the townhouse market. The average N Arlington townhouse has 2,100 sqft above grade and was built in 1988 while the average S Arlington townhouse has just 1,250 sqft and was built in 1960.
2018 Arlington Townhouse Market Highlights
-
The median net sold price increased by 2.6% to $546k
-
The average buyer could only negotiate 1.2% off the original asking price, which is less than what condo and detached single-family buyers were able to negotiate last year
-
The average 2BR sold for $483k, the average 3BR sold for $753k, and the average 4BR sold for $906k
-
The 531 sales in 2018, two-thirds of which were in S Arlington, came in just below the 559 in 2017
-
If you are looking for a townhouse built since 2000, be prepared to spend over $1M. The average net sold price in 2018 was just over $997k.
-
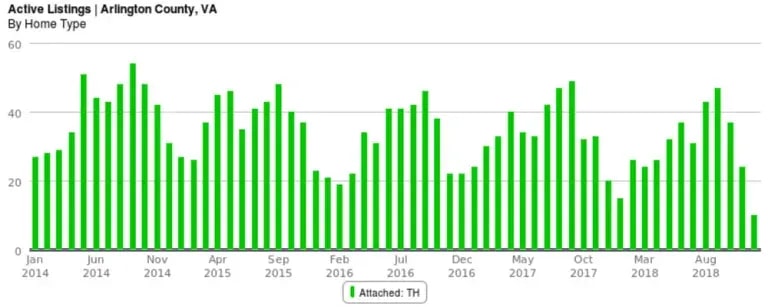
Inventory has been slowly trending downward over the last five years, but like everything else in Arlington, has reached an all-time low since the Amazon announcement. Before December, the lowest average monthly inventory over the last five years had been 15 (Jan ’18) and 19 (Feb ’16), and December ’18 averaged just 10 homes available. As of January 21st, there are 15 on the market.
Up next week….a similar look at the impact Amazon’s decision had on the Arlington market!
If you are buying or selling a home in or around Arlington in 2019 and would like to talk more about your strategy, you can send me an email at [email protected] to schedule a meeting.